
Here are our products


Fair Insight is a platform for individual investors, wholesalers and financial advisors to visually compare investments, select investments, build model portfolios, align portfolio & client risk, and optimize client performance among various portfolio alternatives.
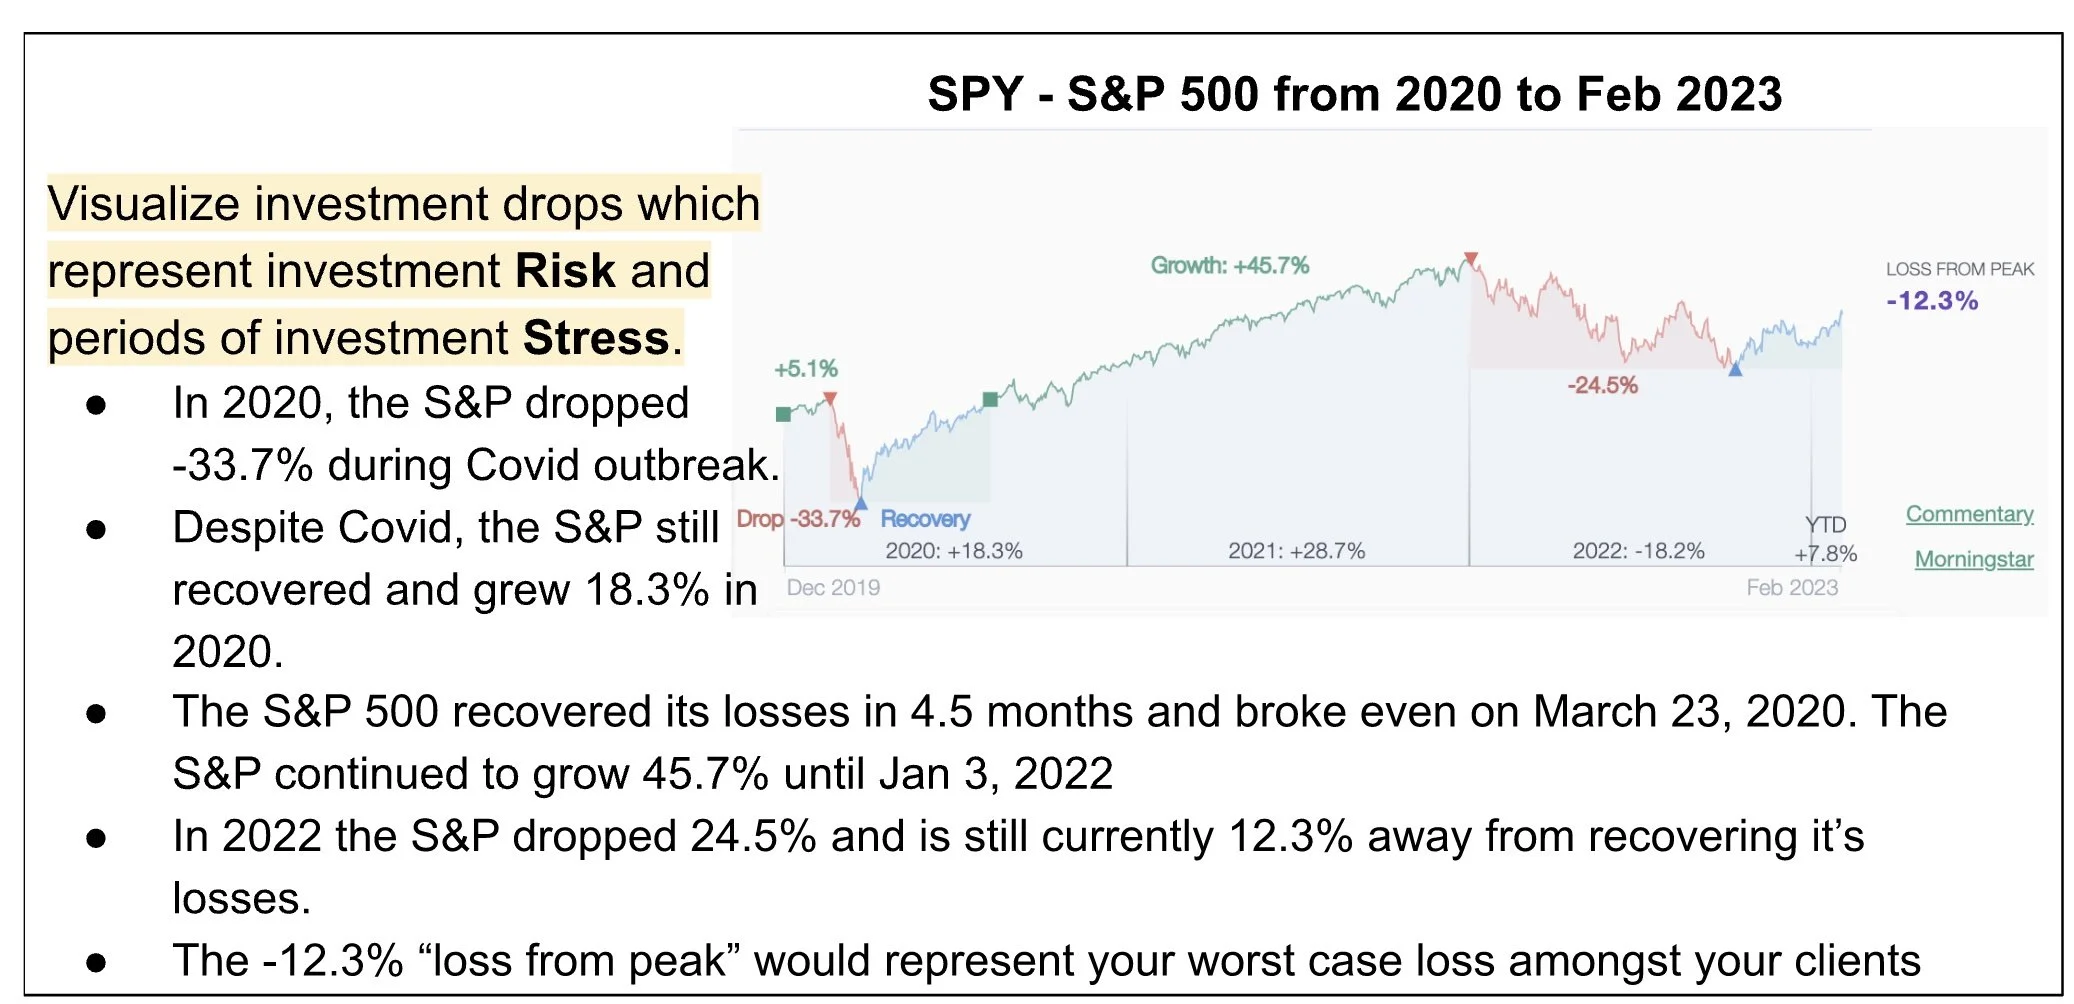
Visualize investment risk and stress
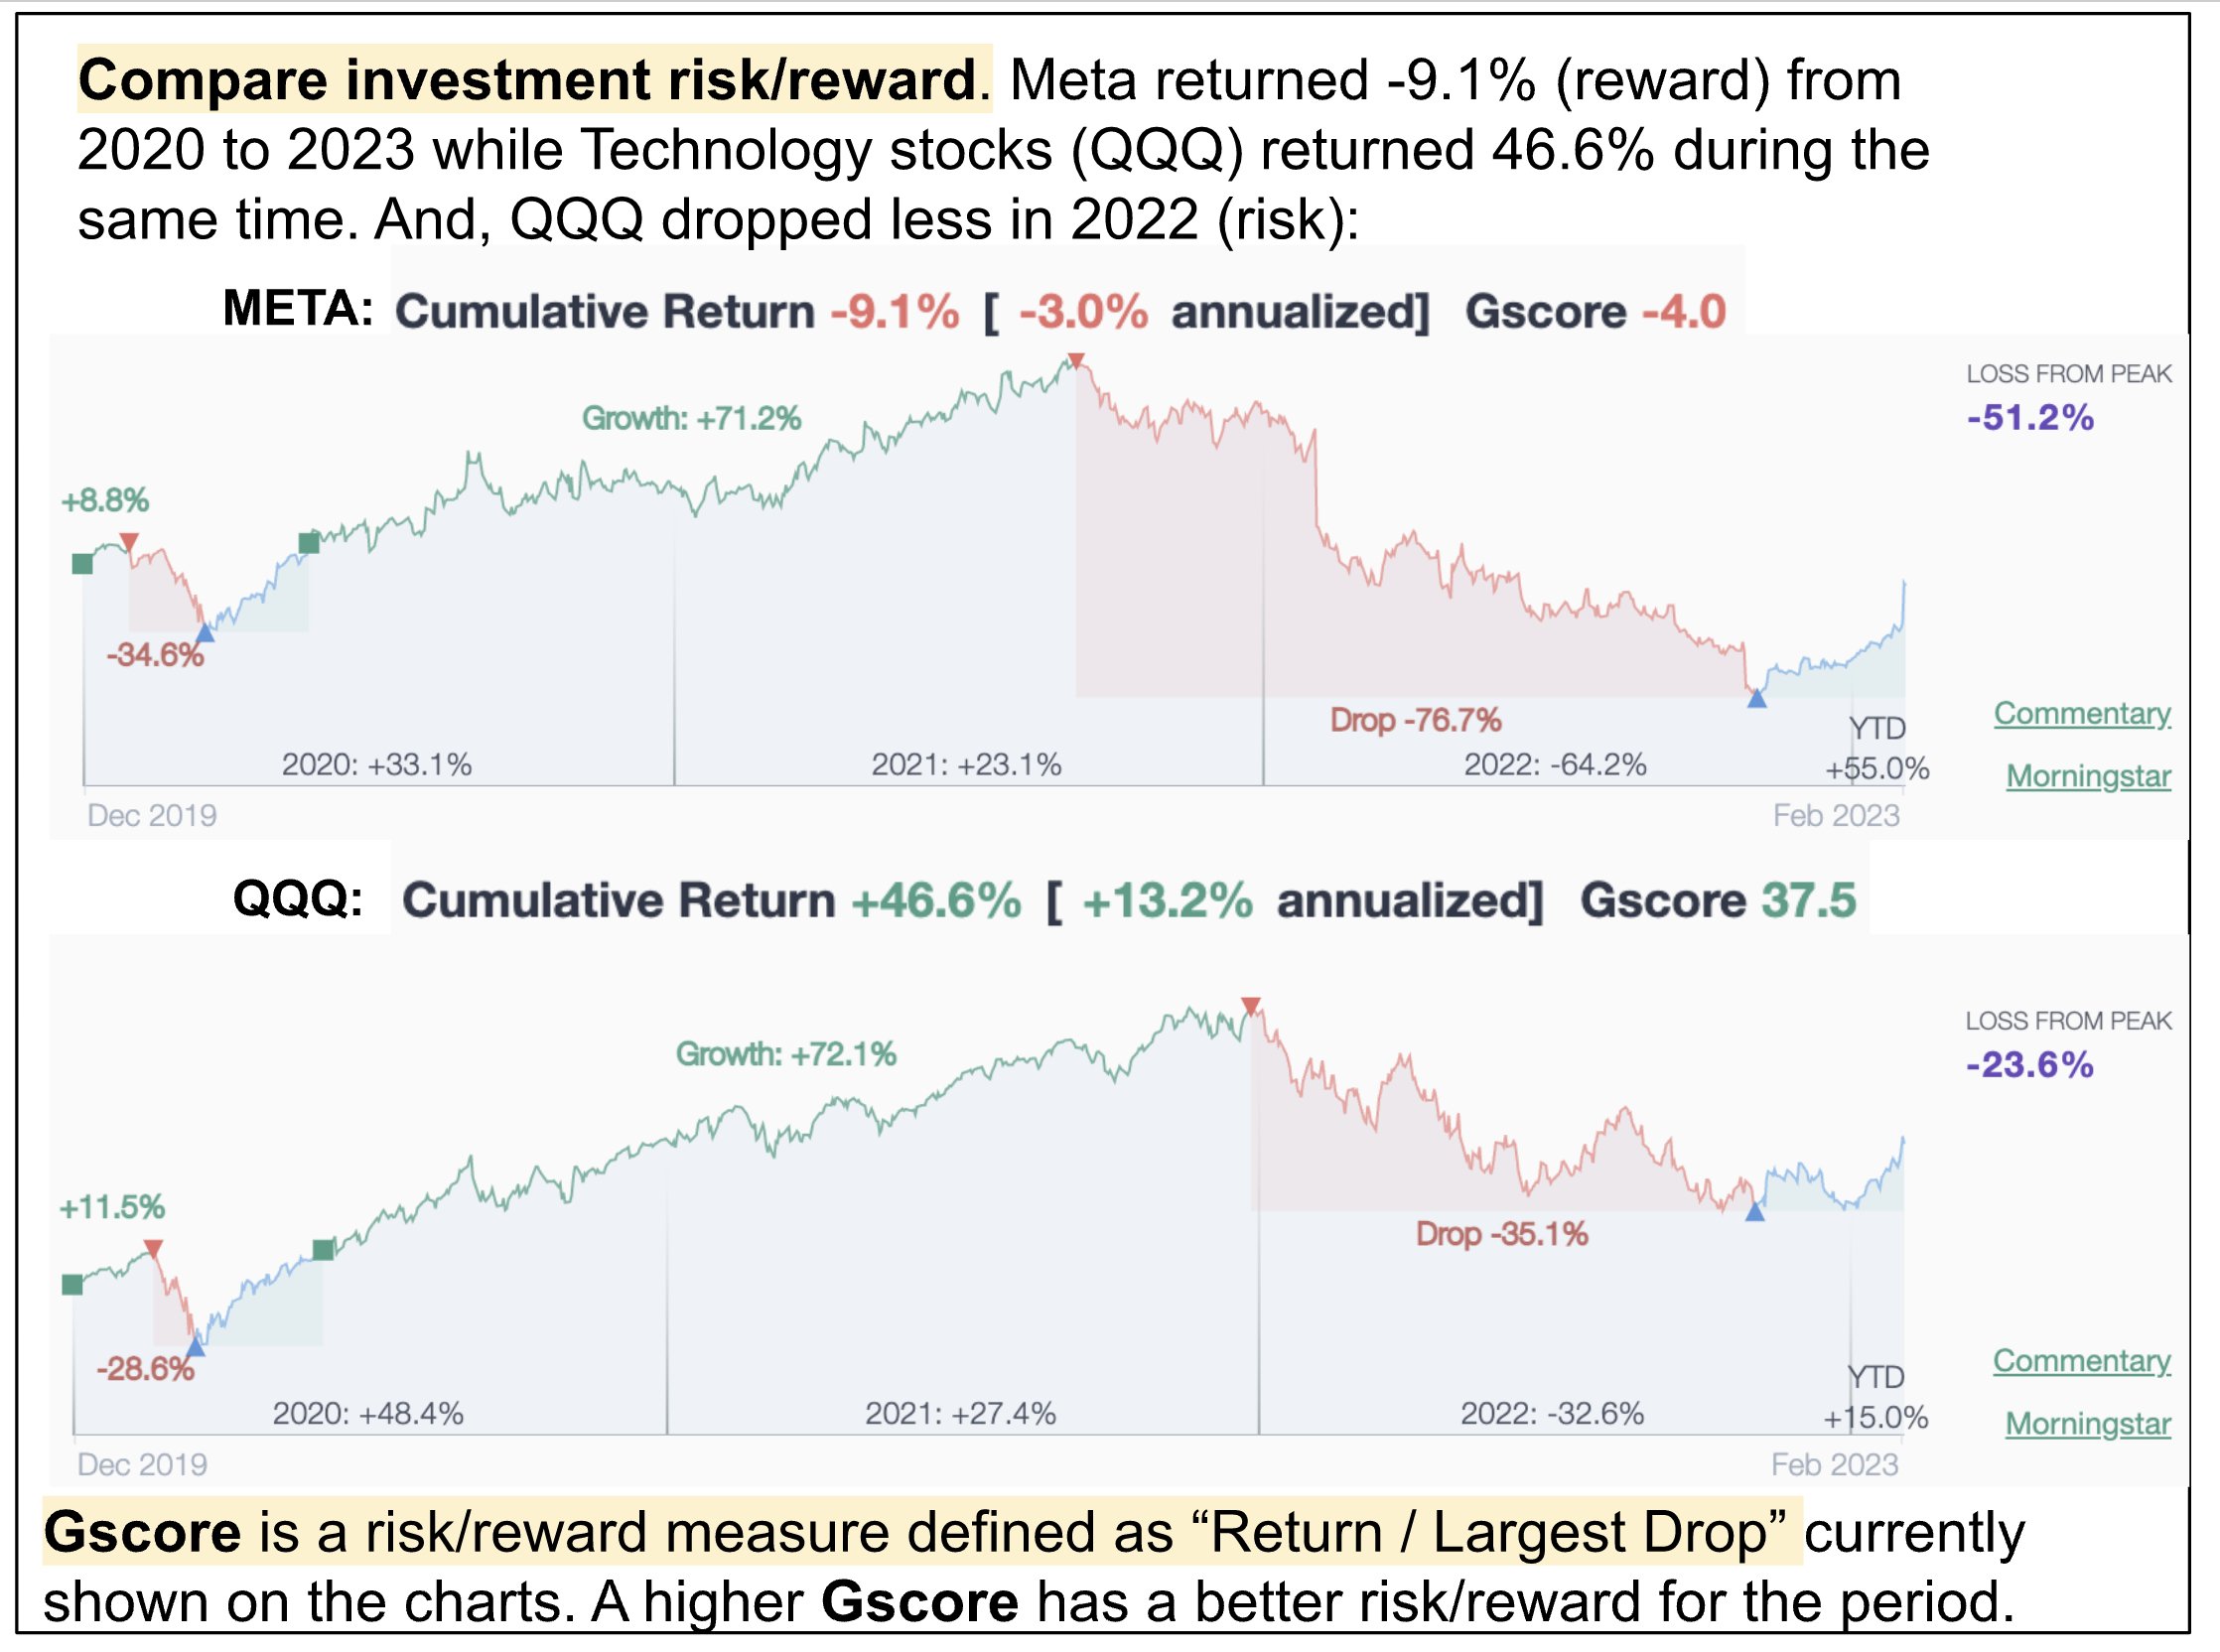
Compare investment risk/reward
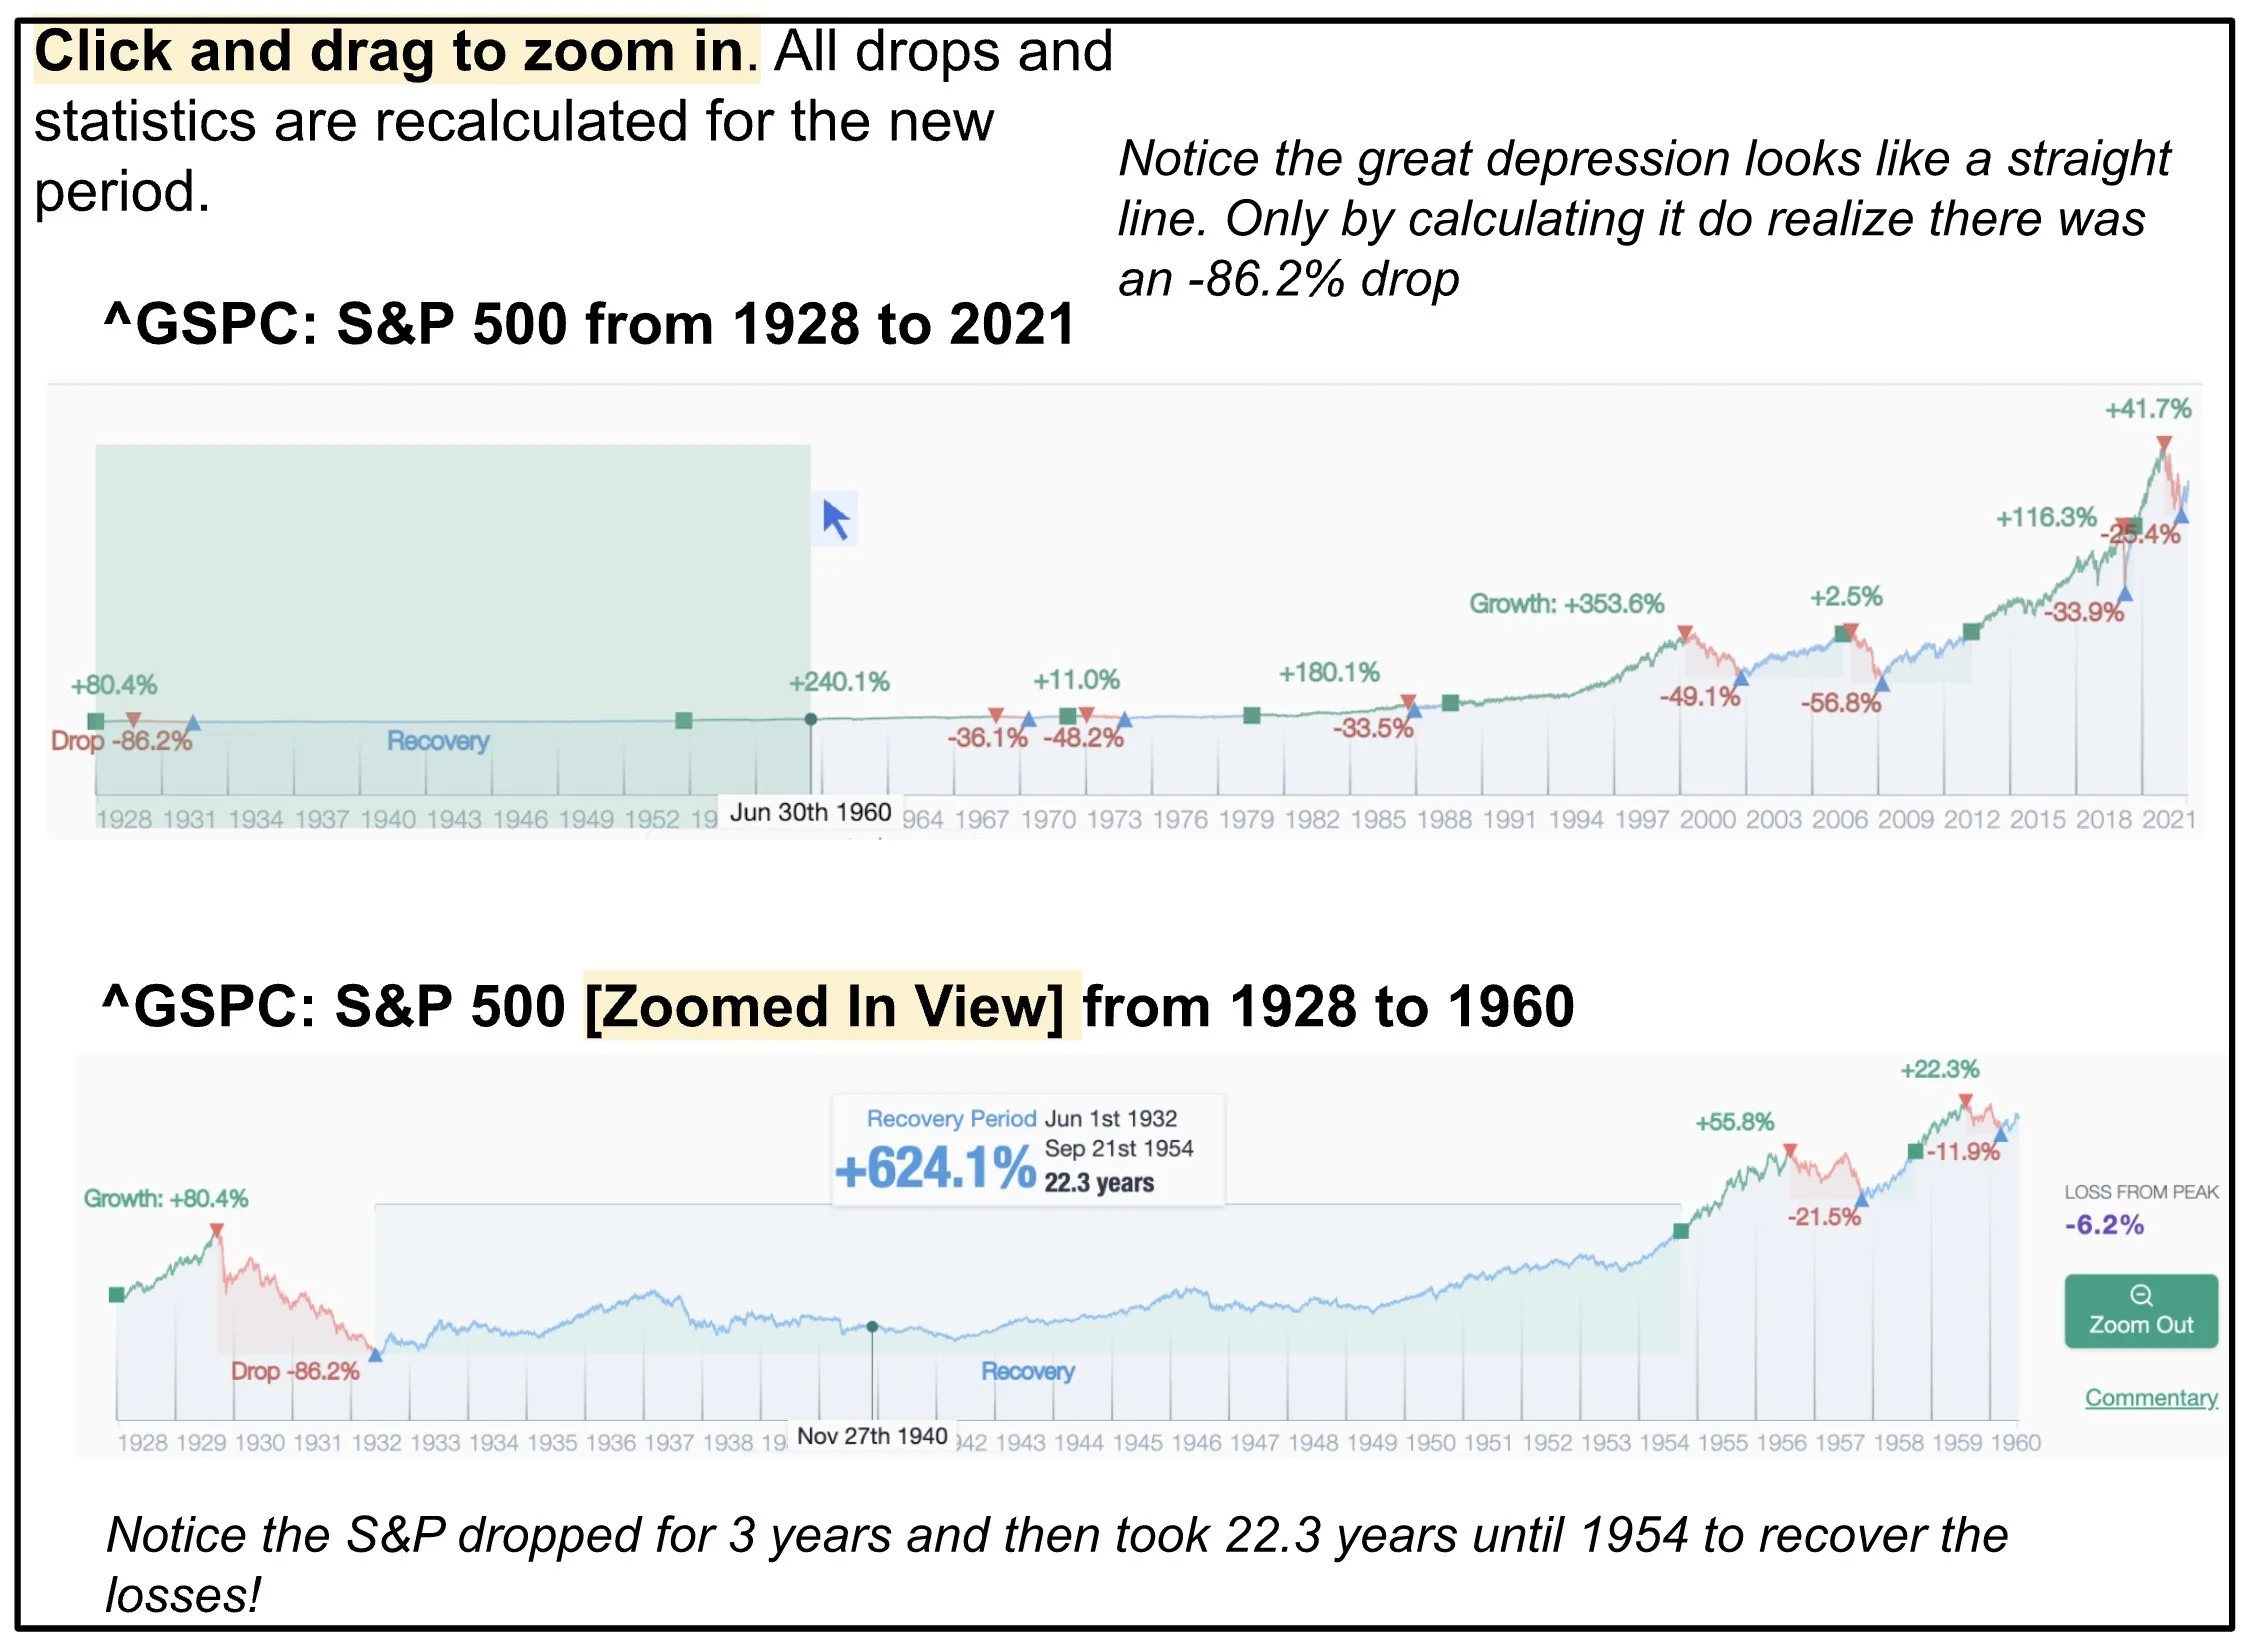
Adjust viewing dimensions
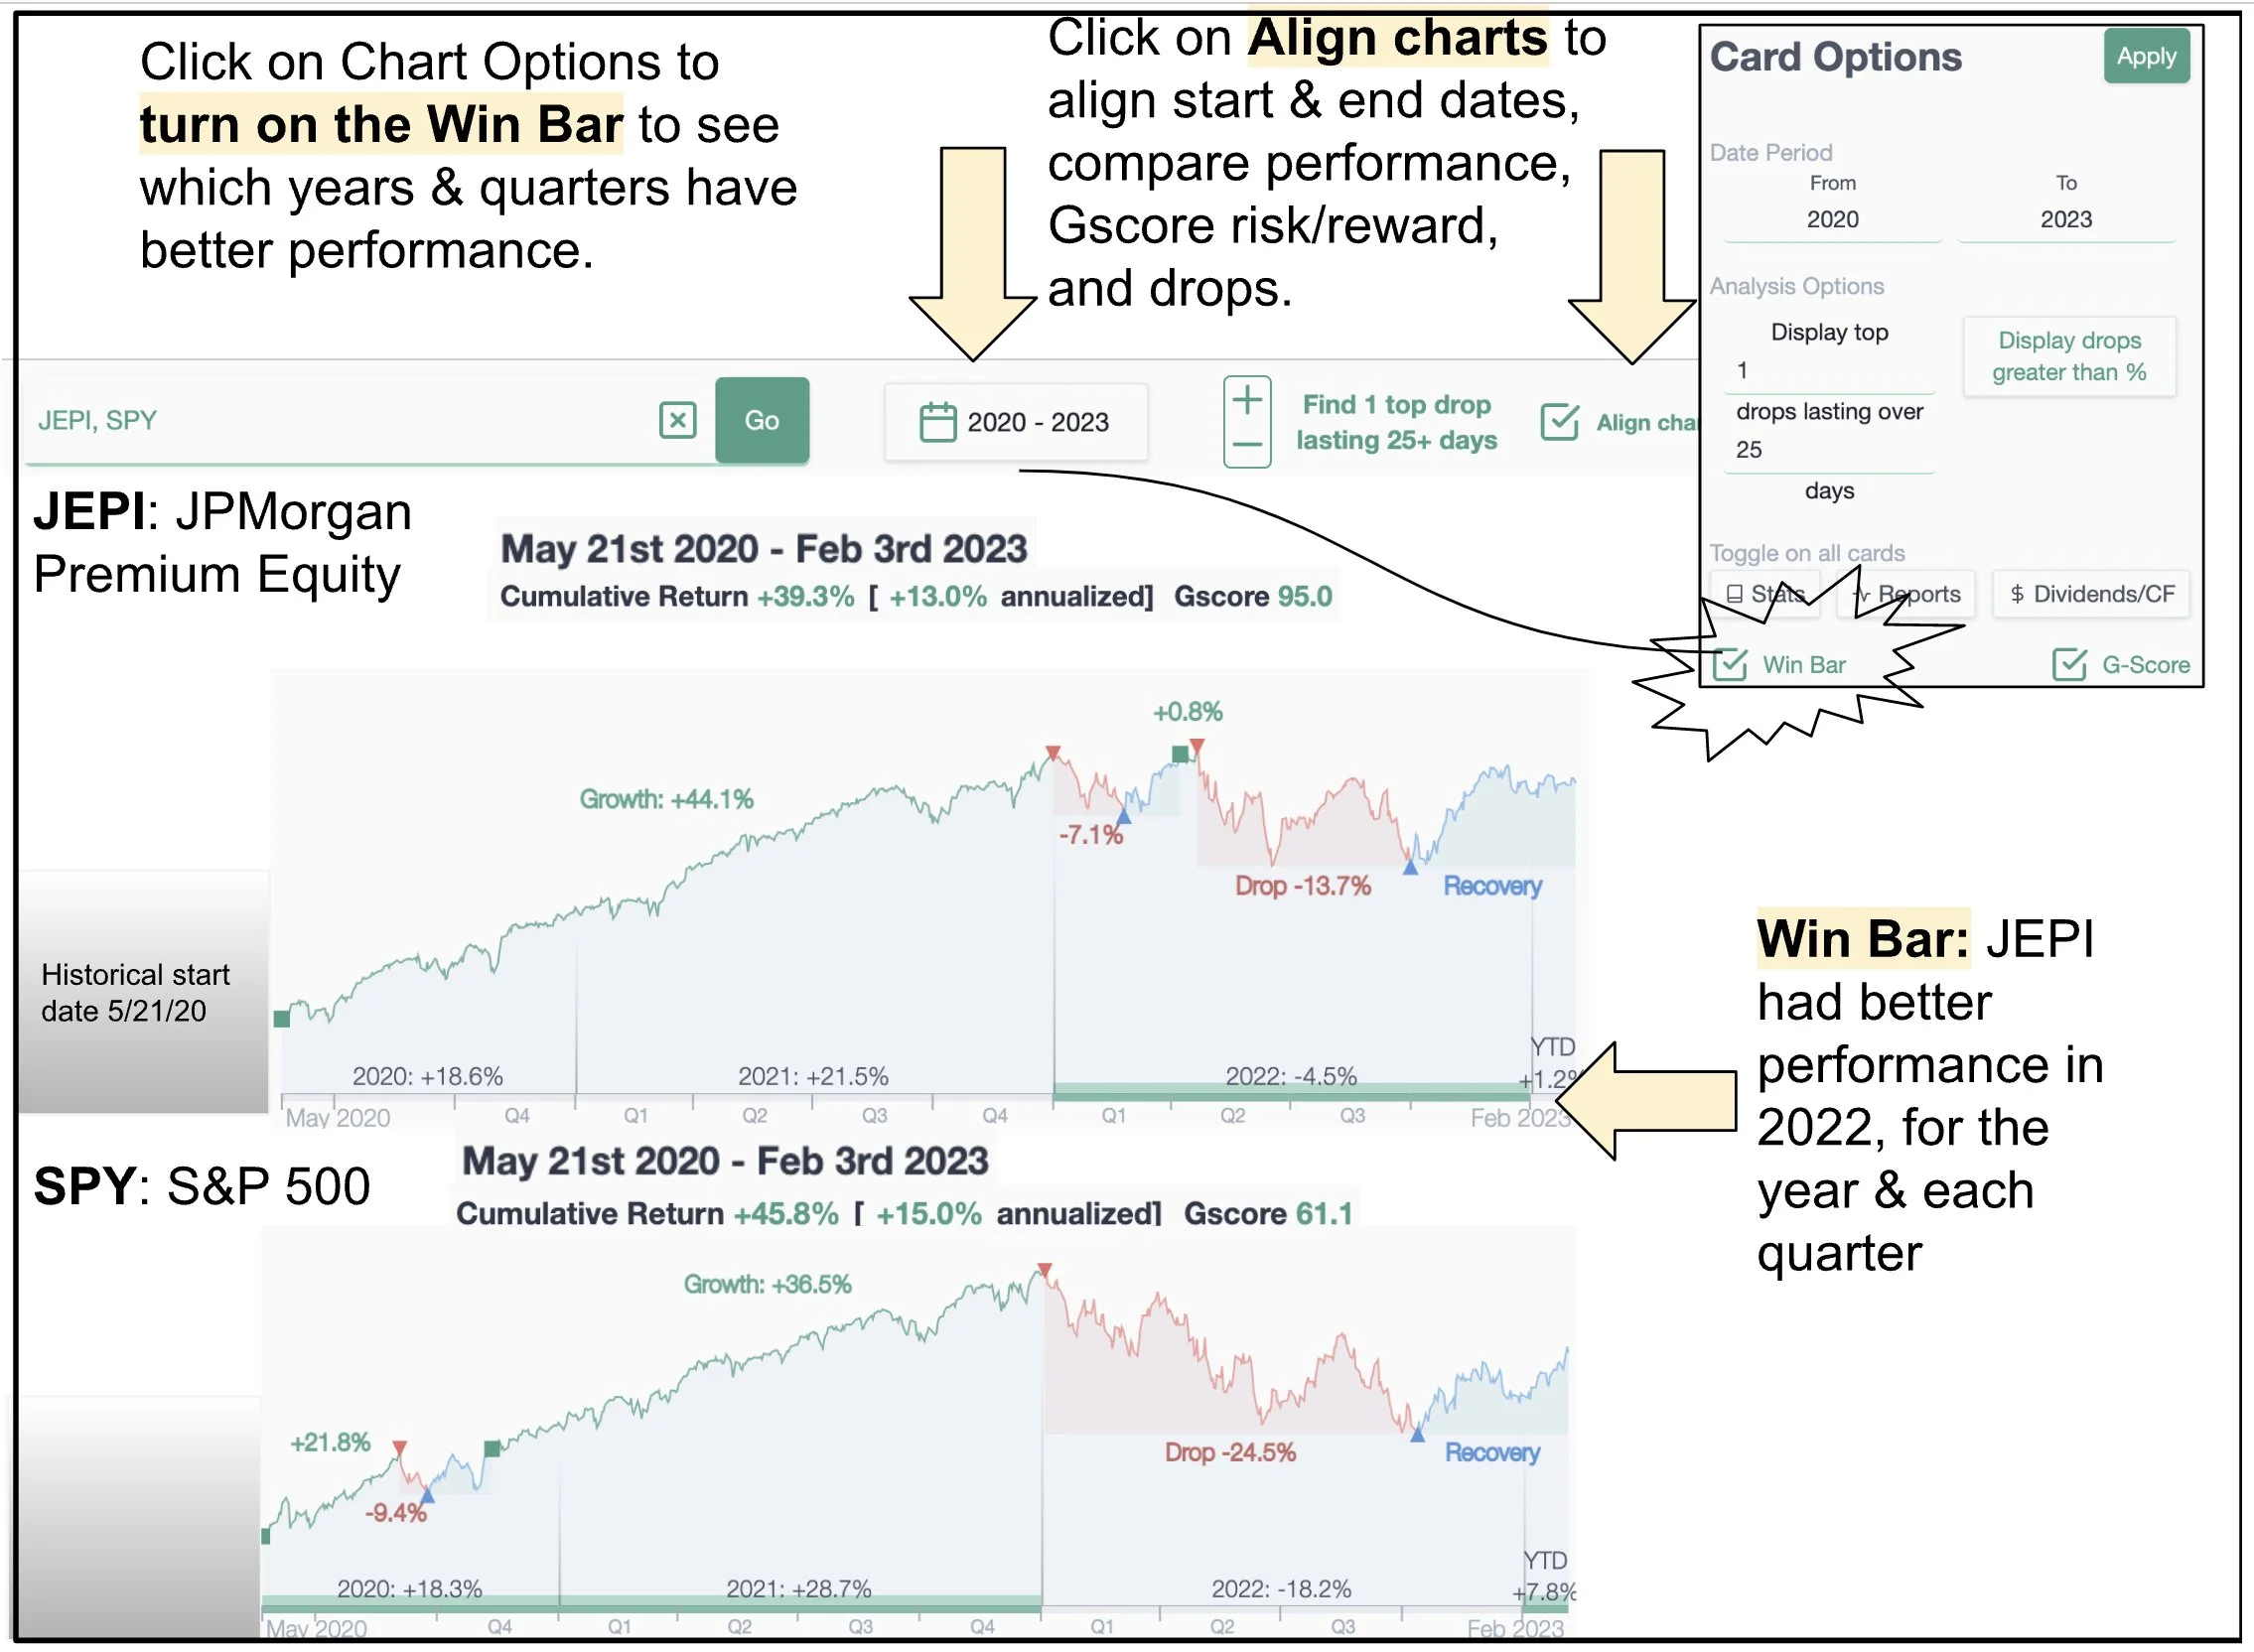
The Win Bar
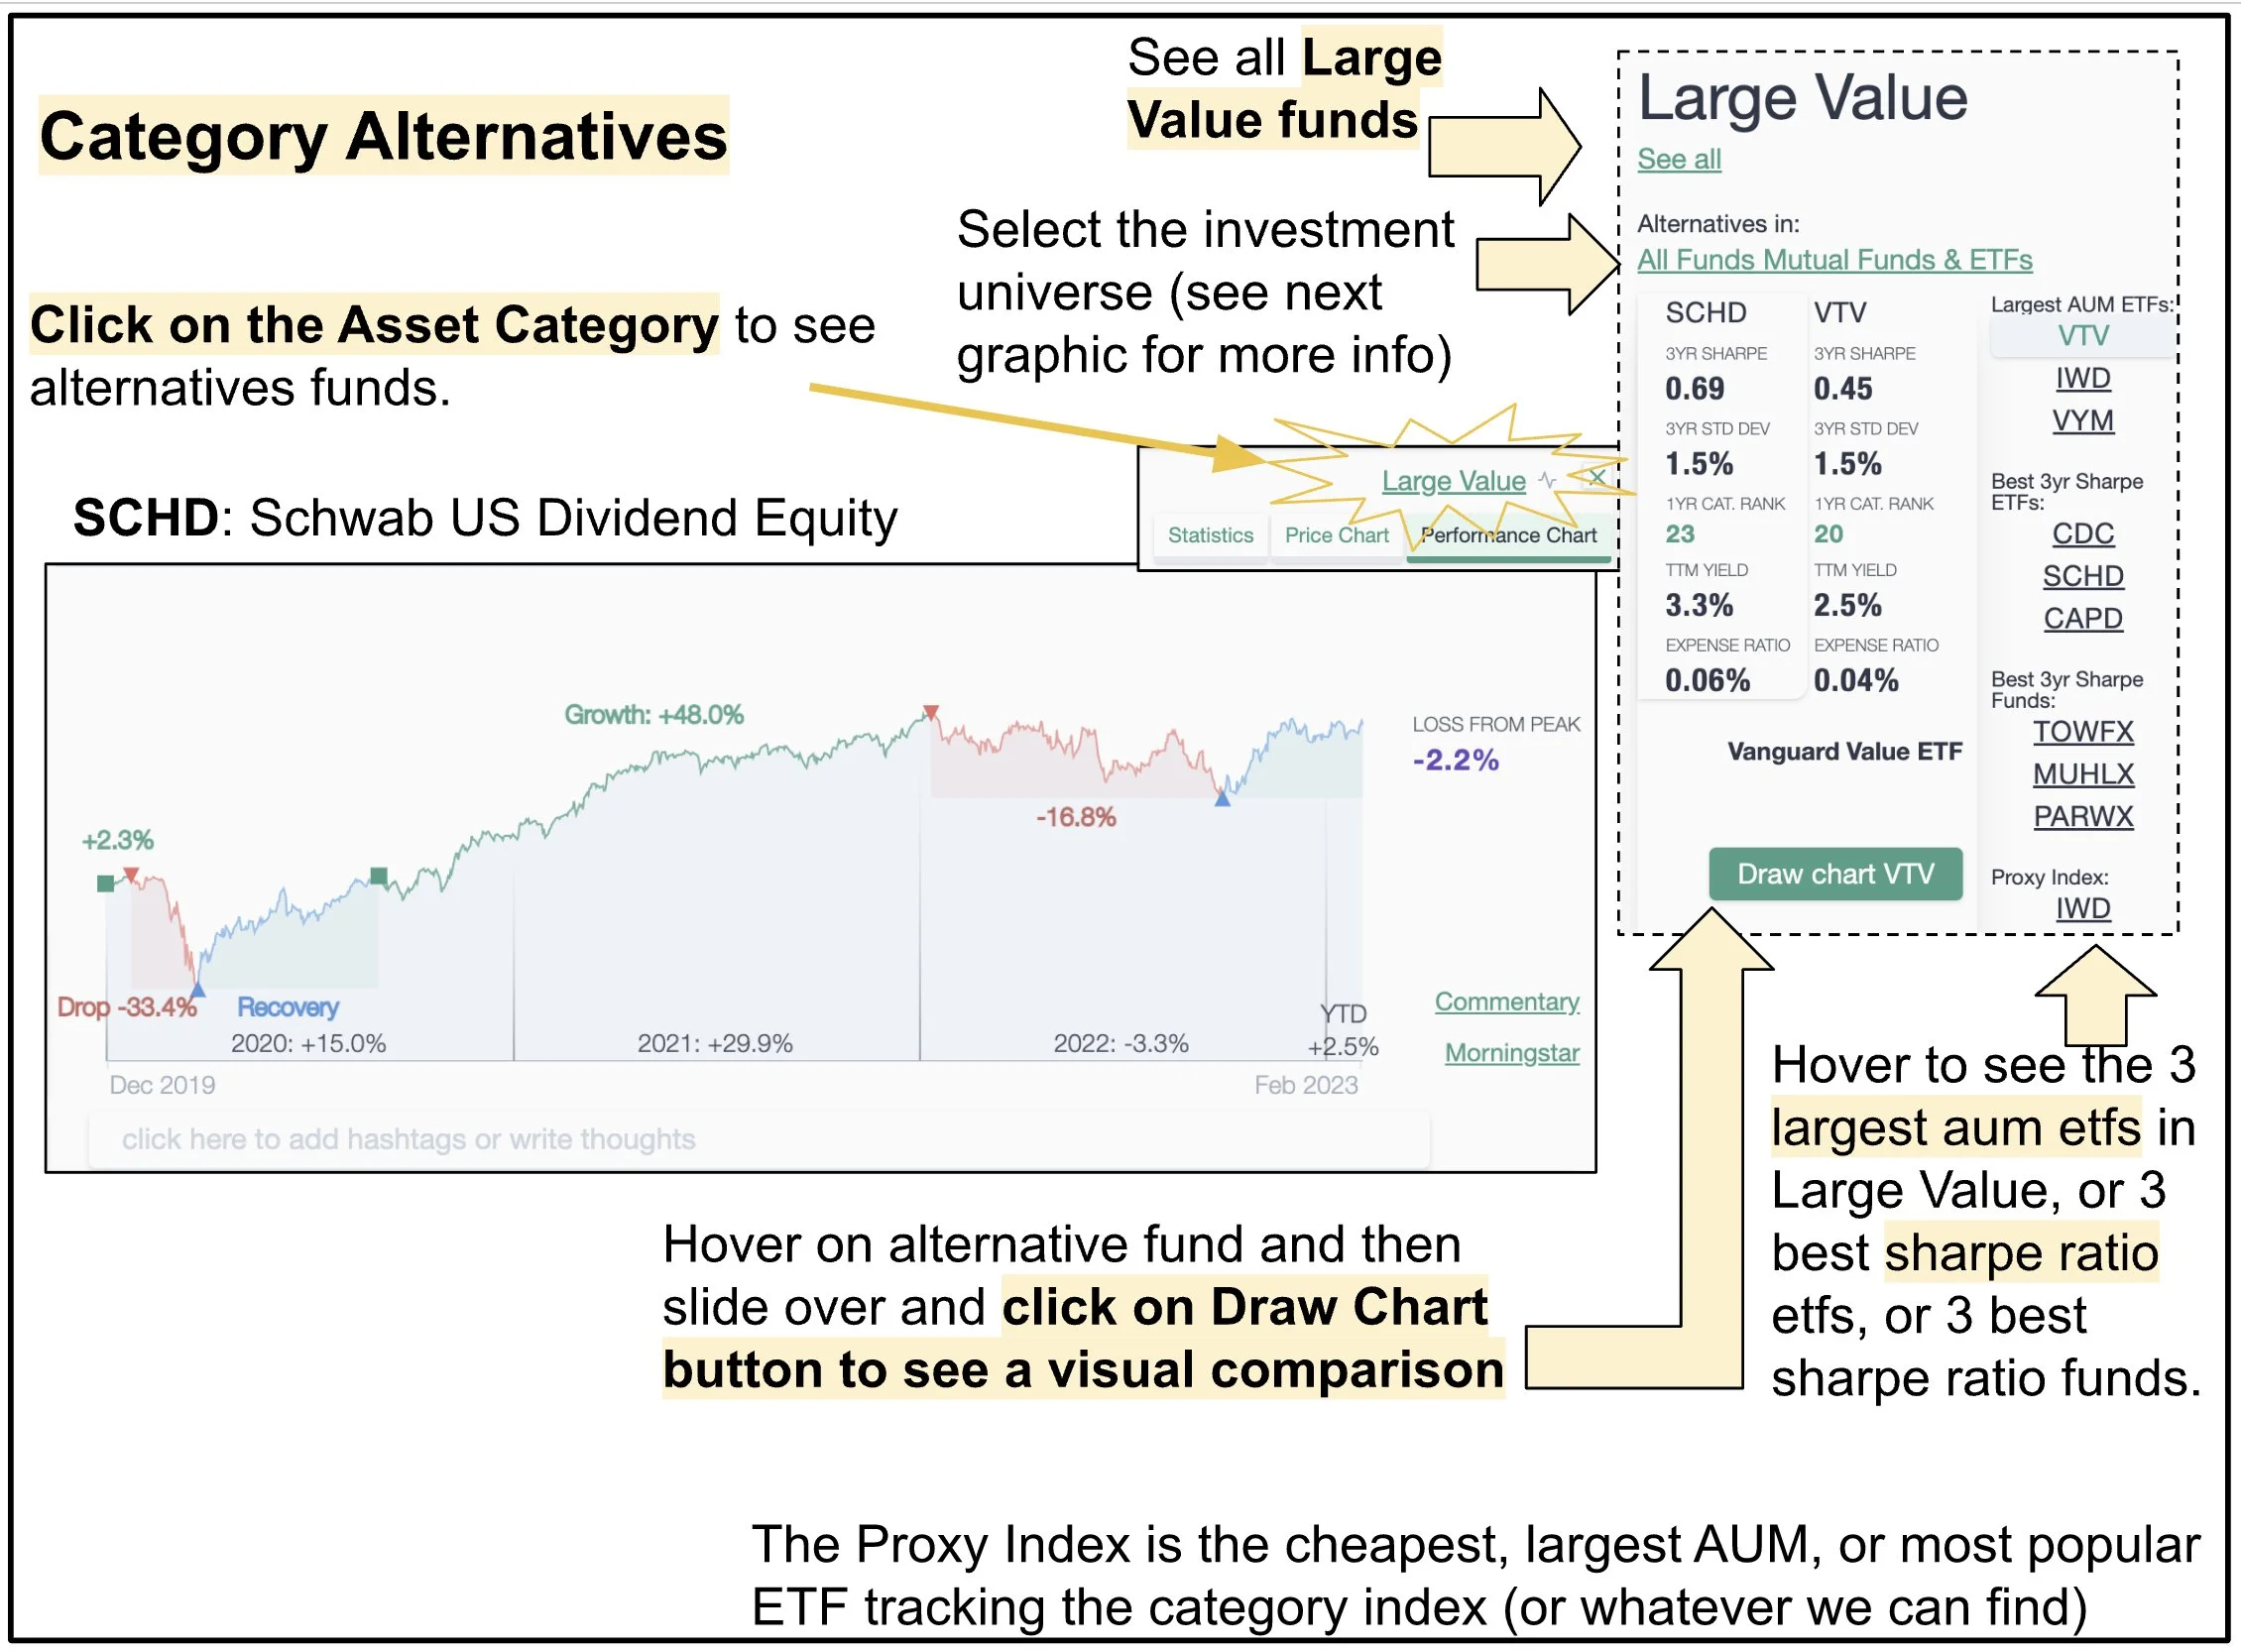
Search for Category Alternatives
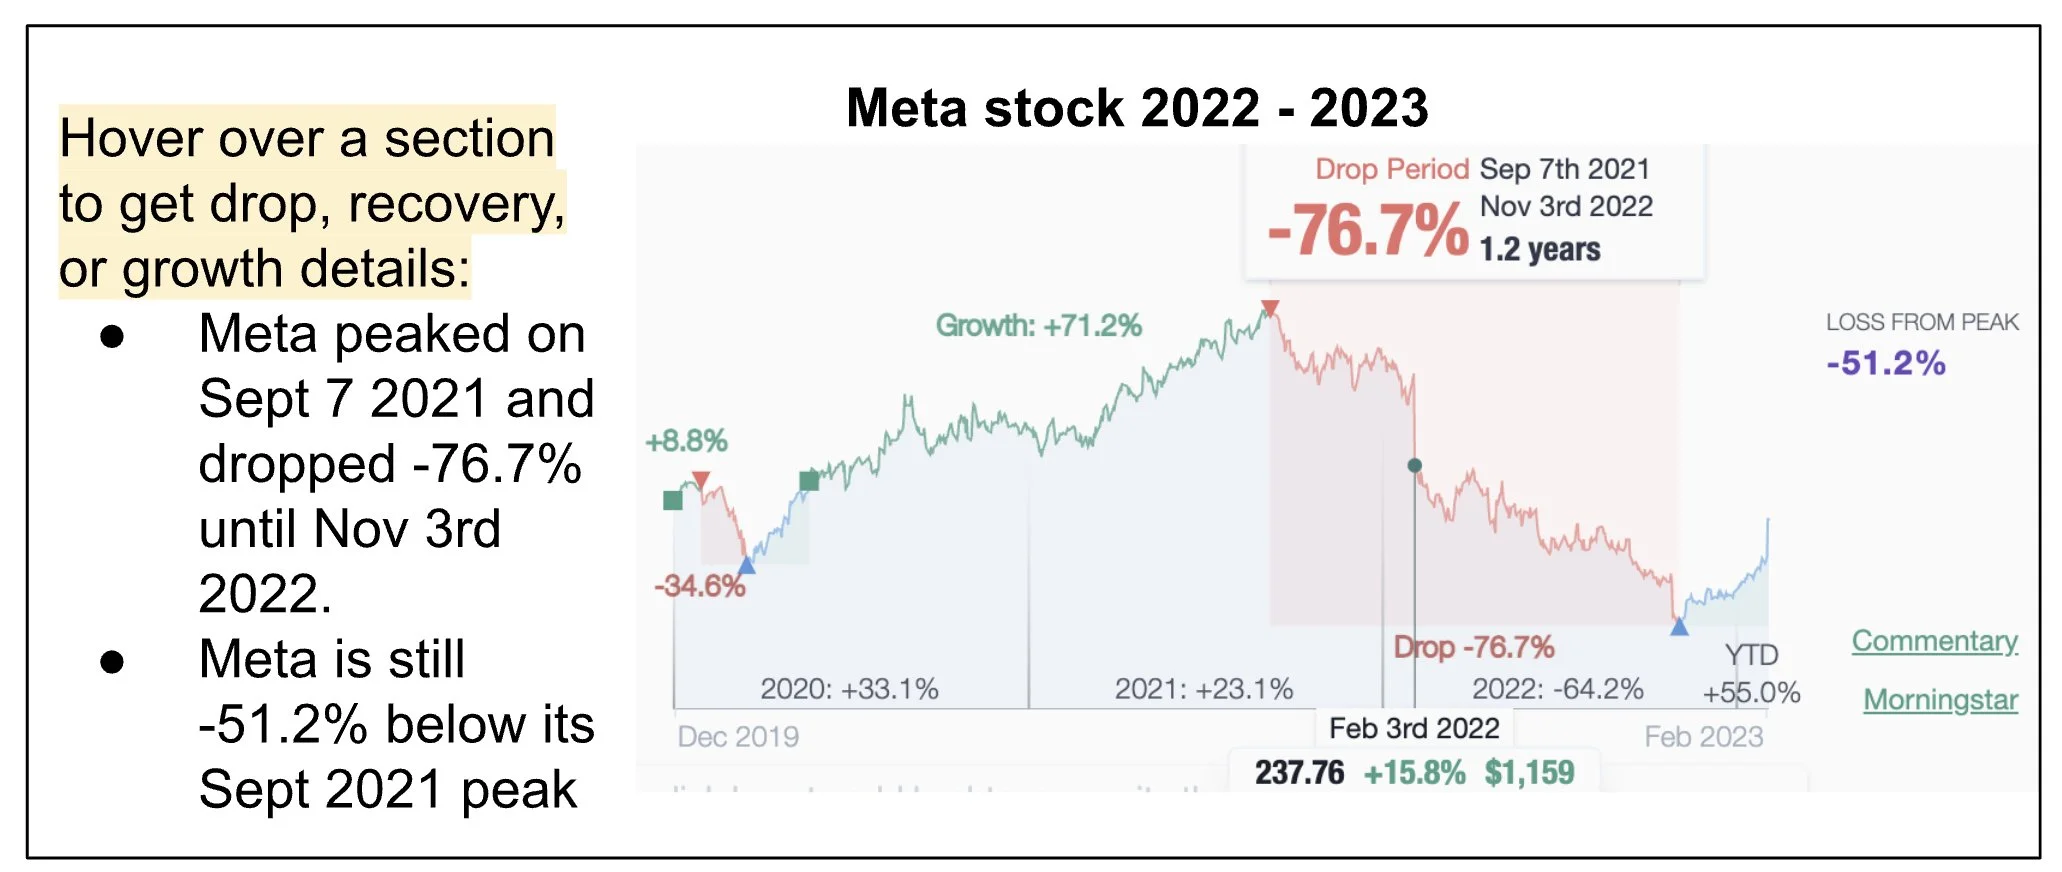
Analyze your investment’s drops and recovery periods
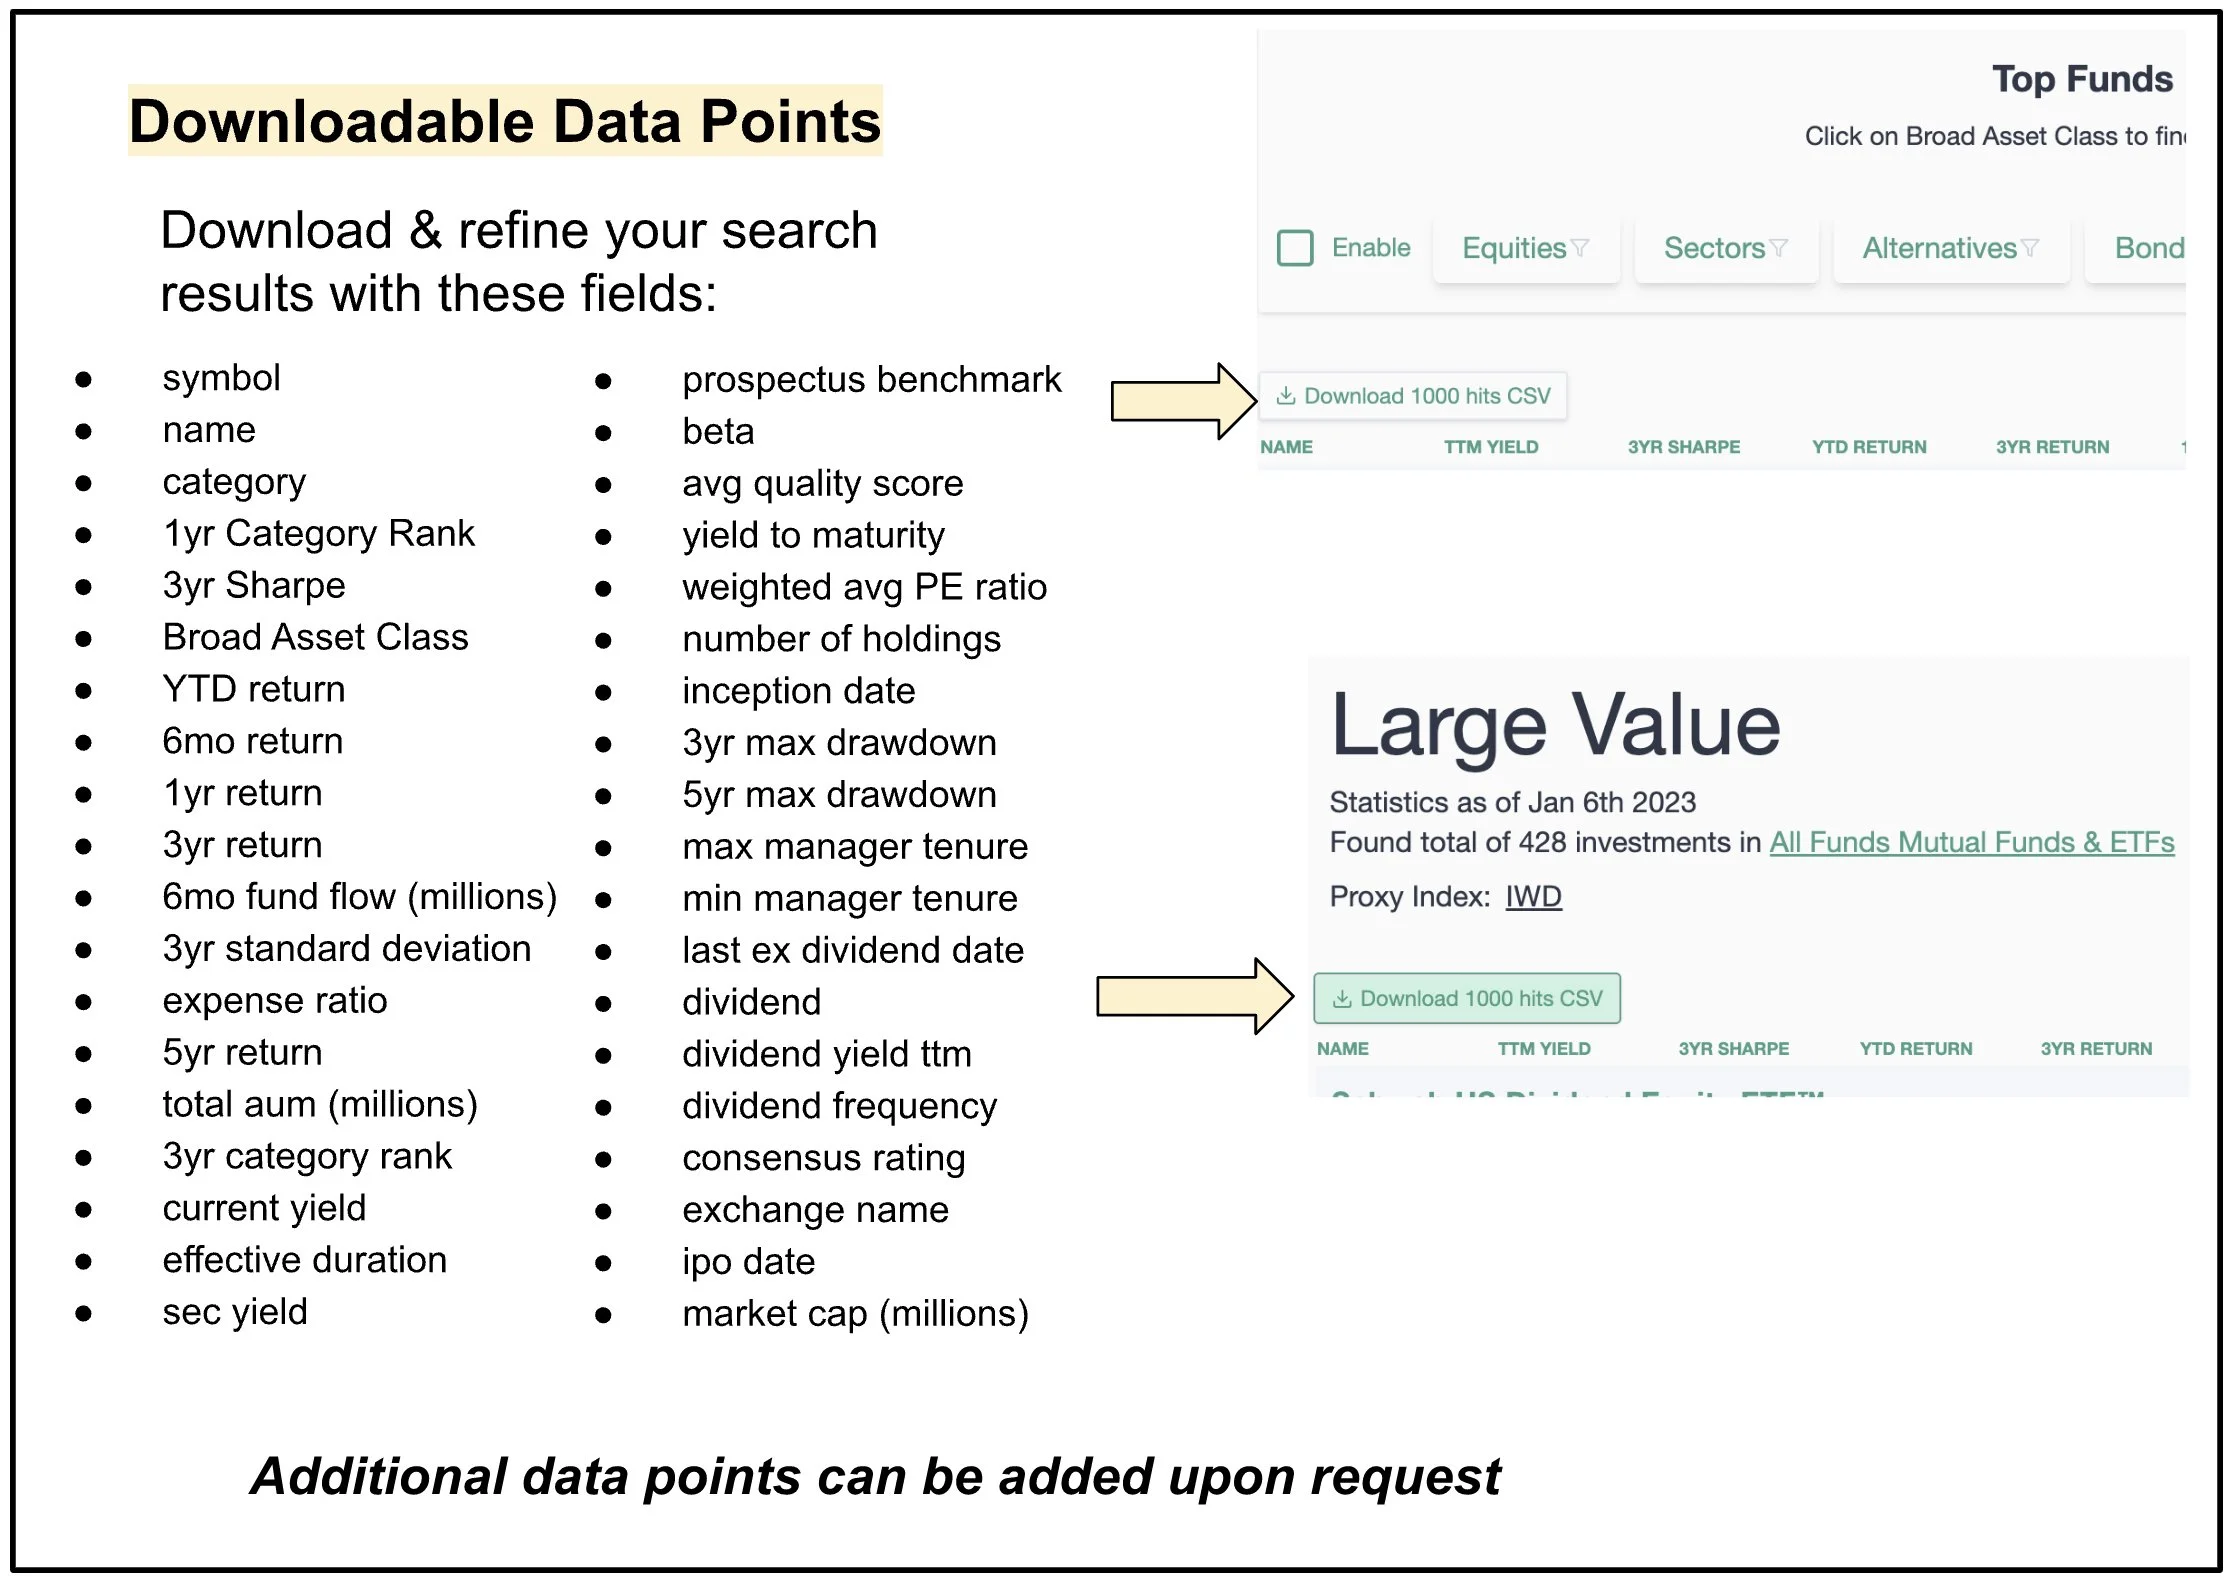
Downloadable Data Points
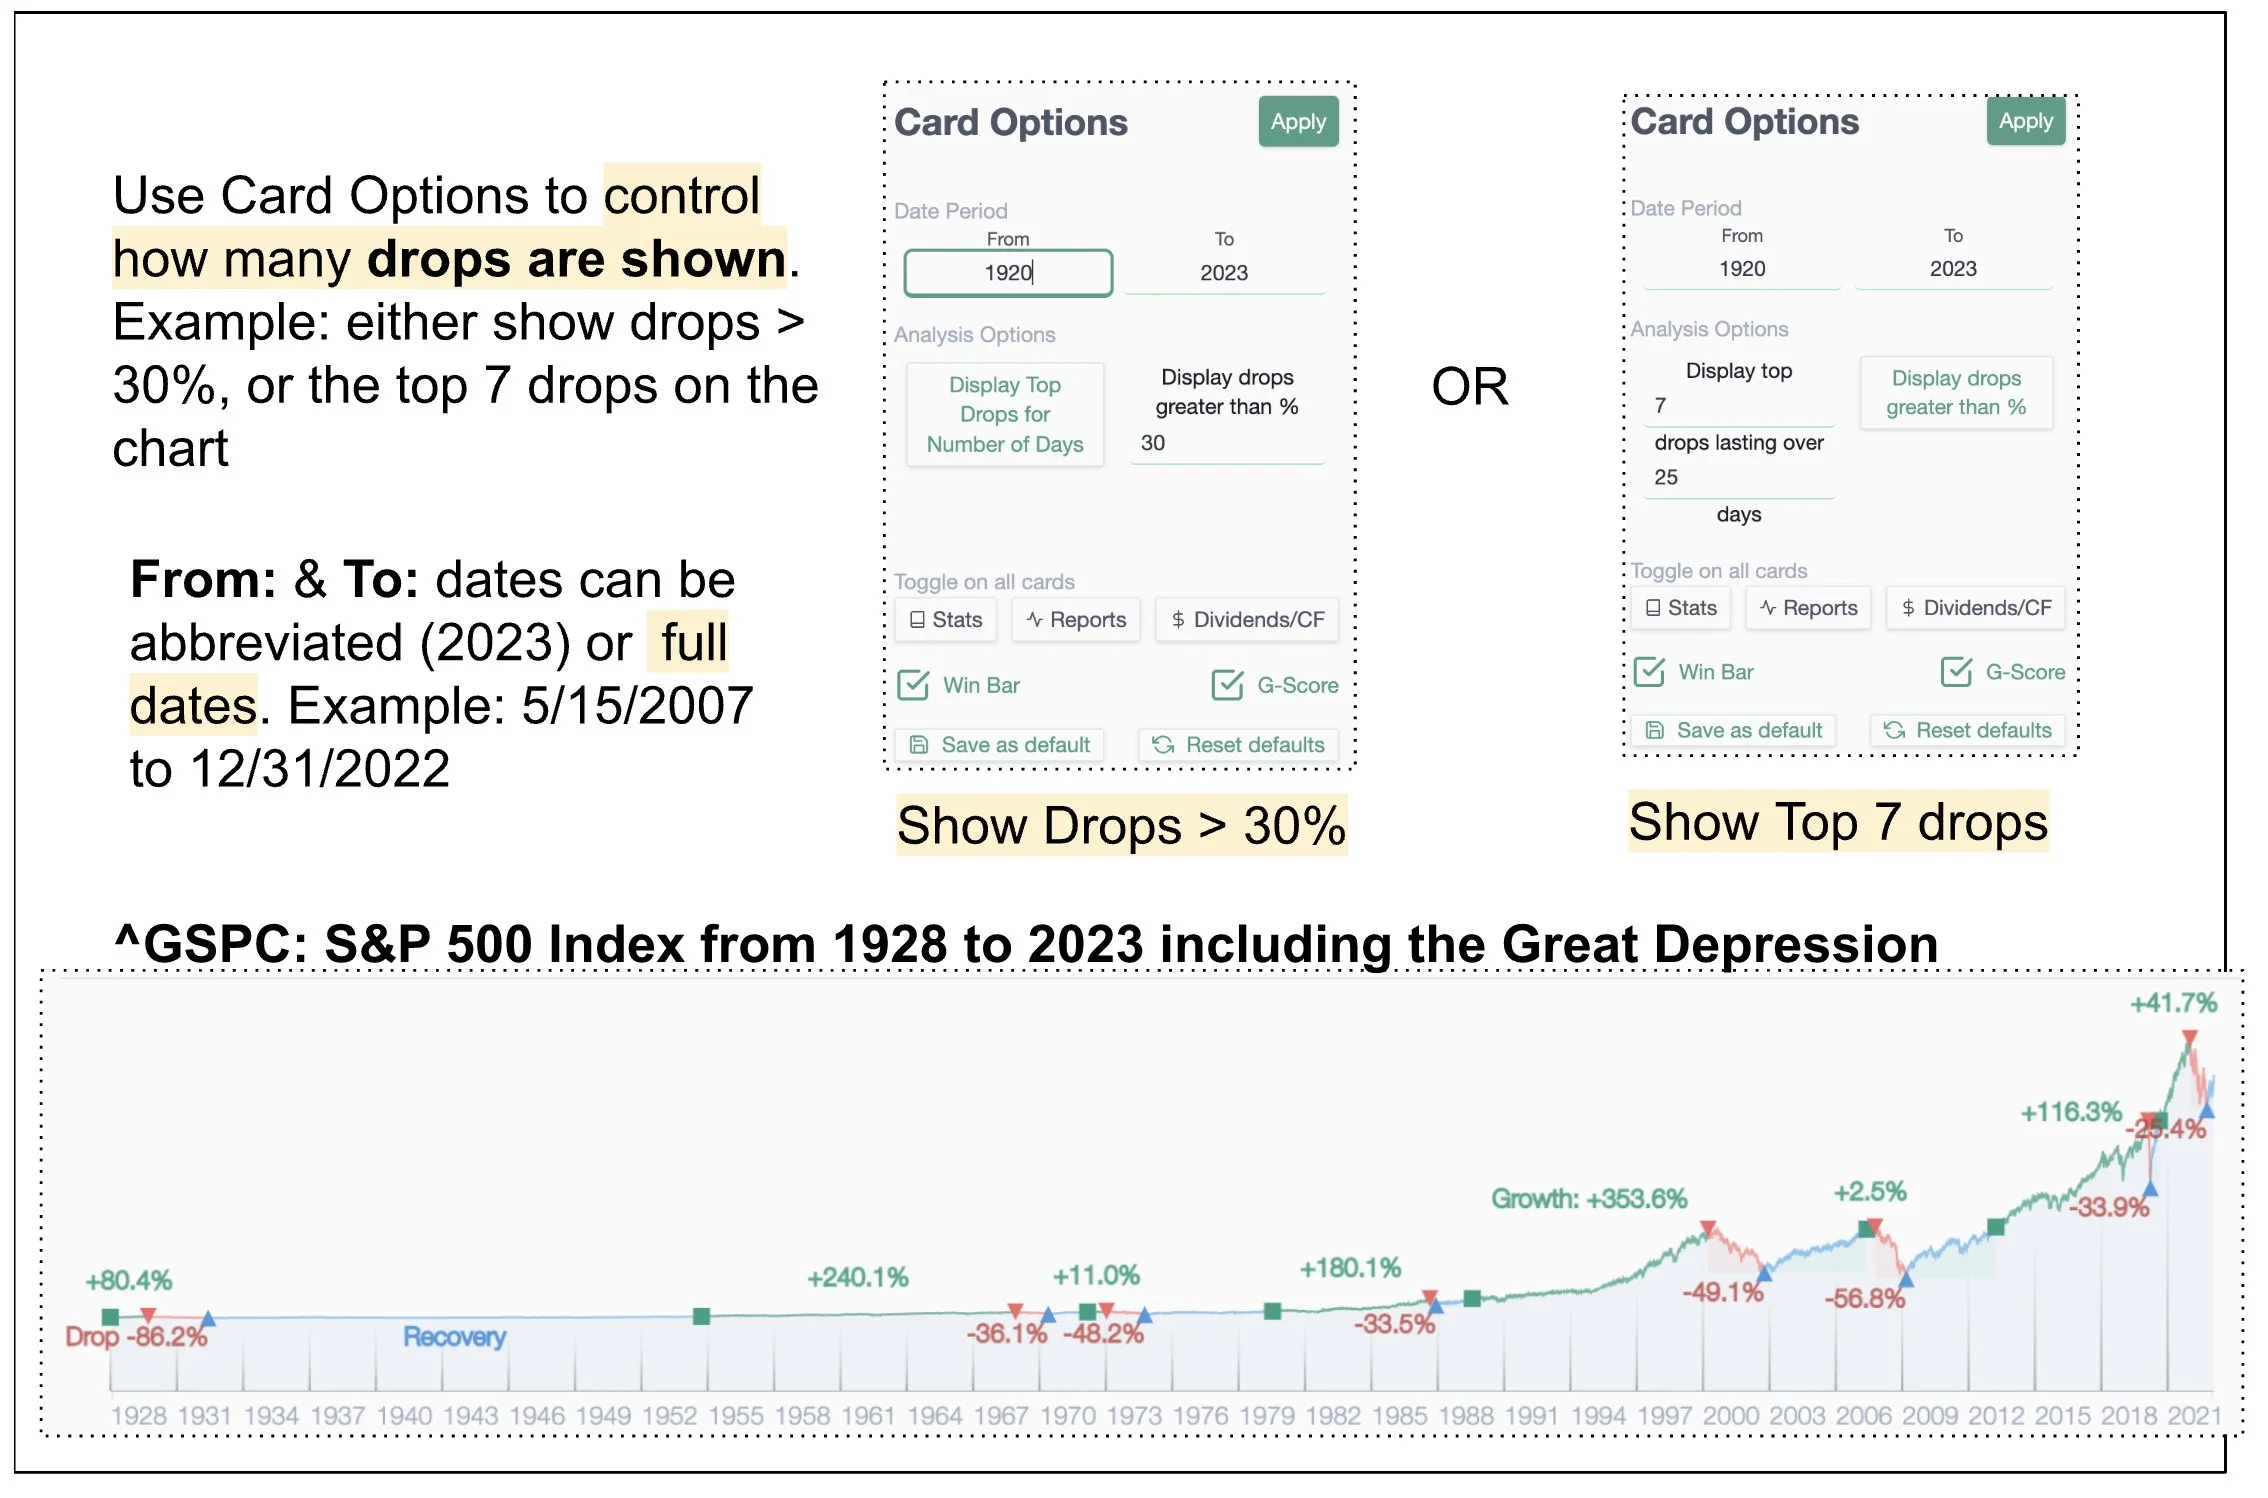
Adjust how many drops over a specific timeframe are shown
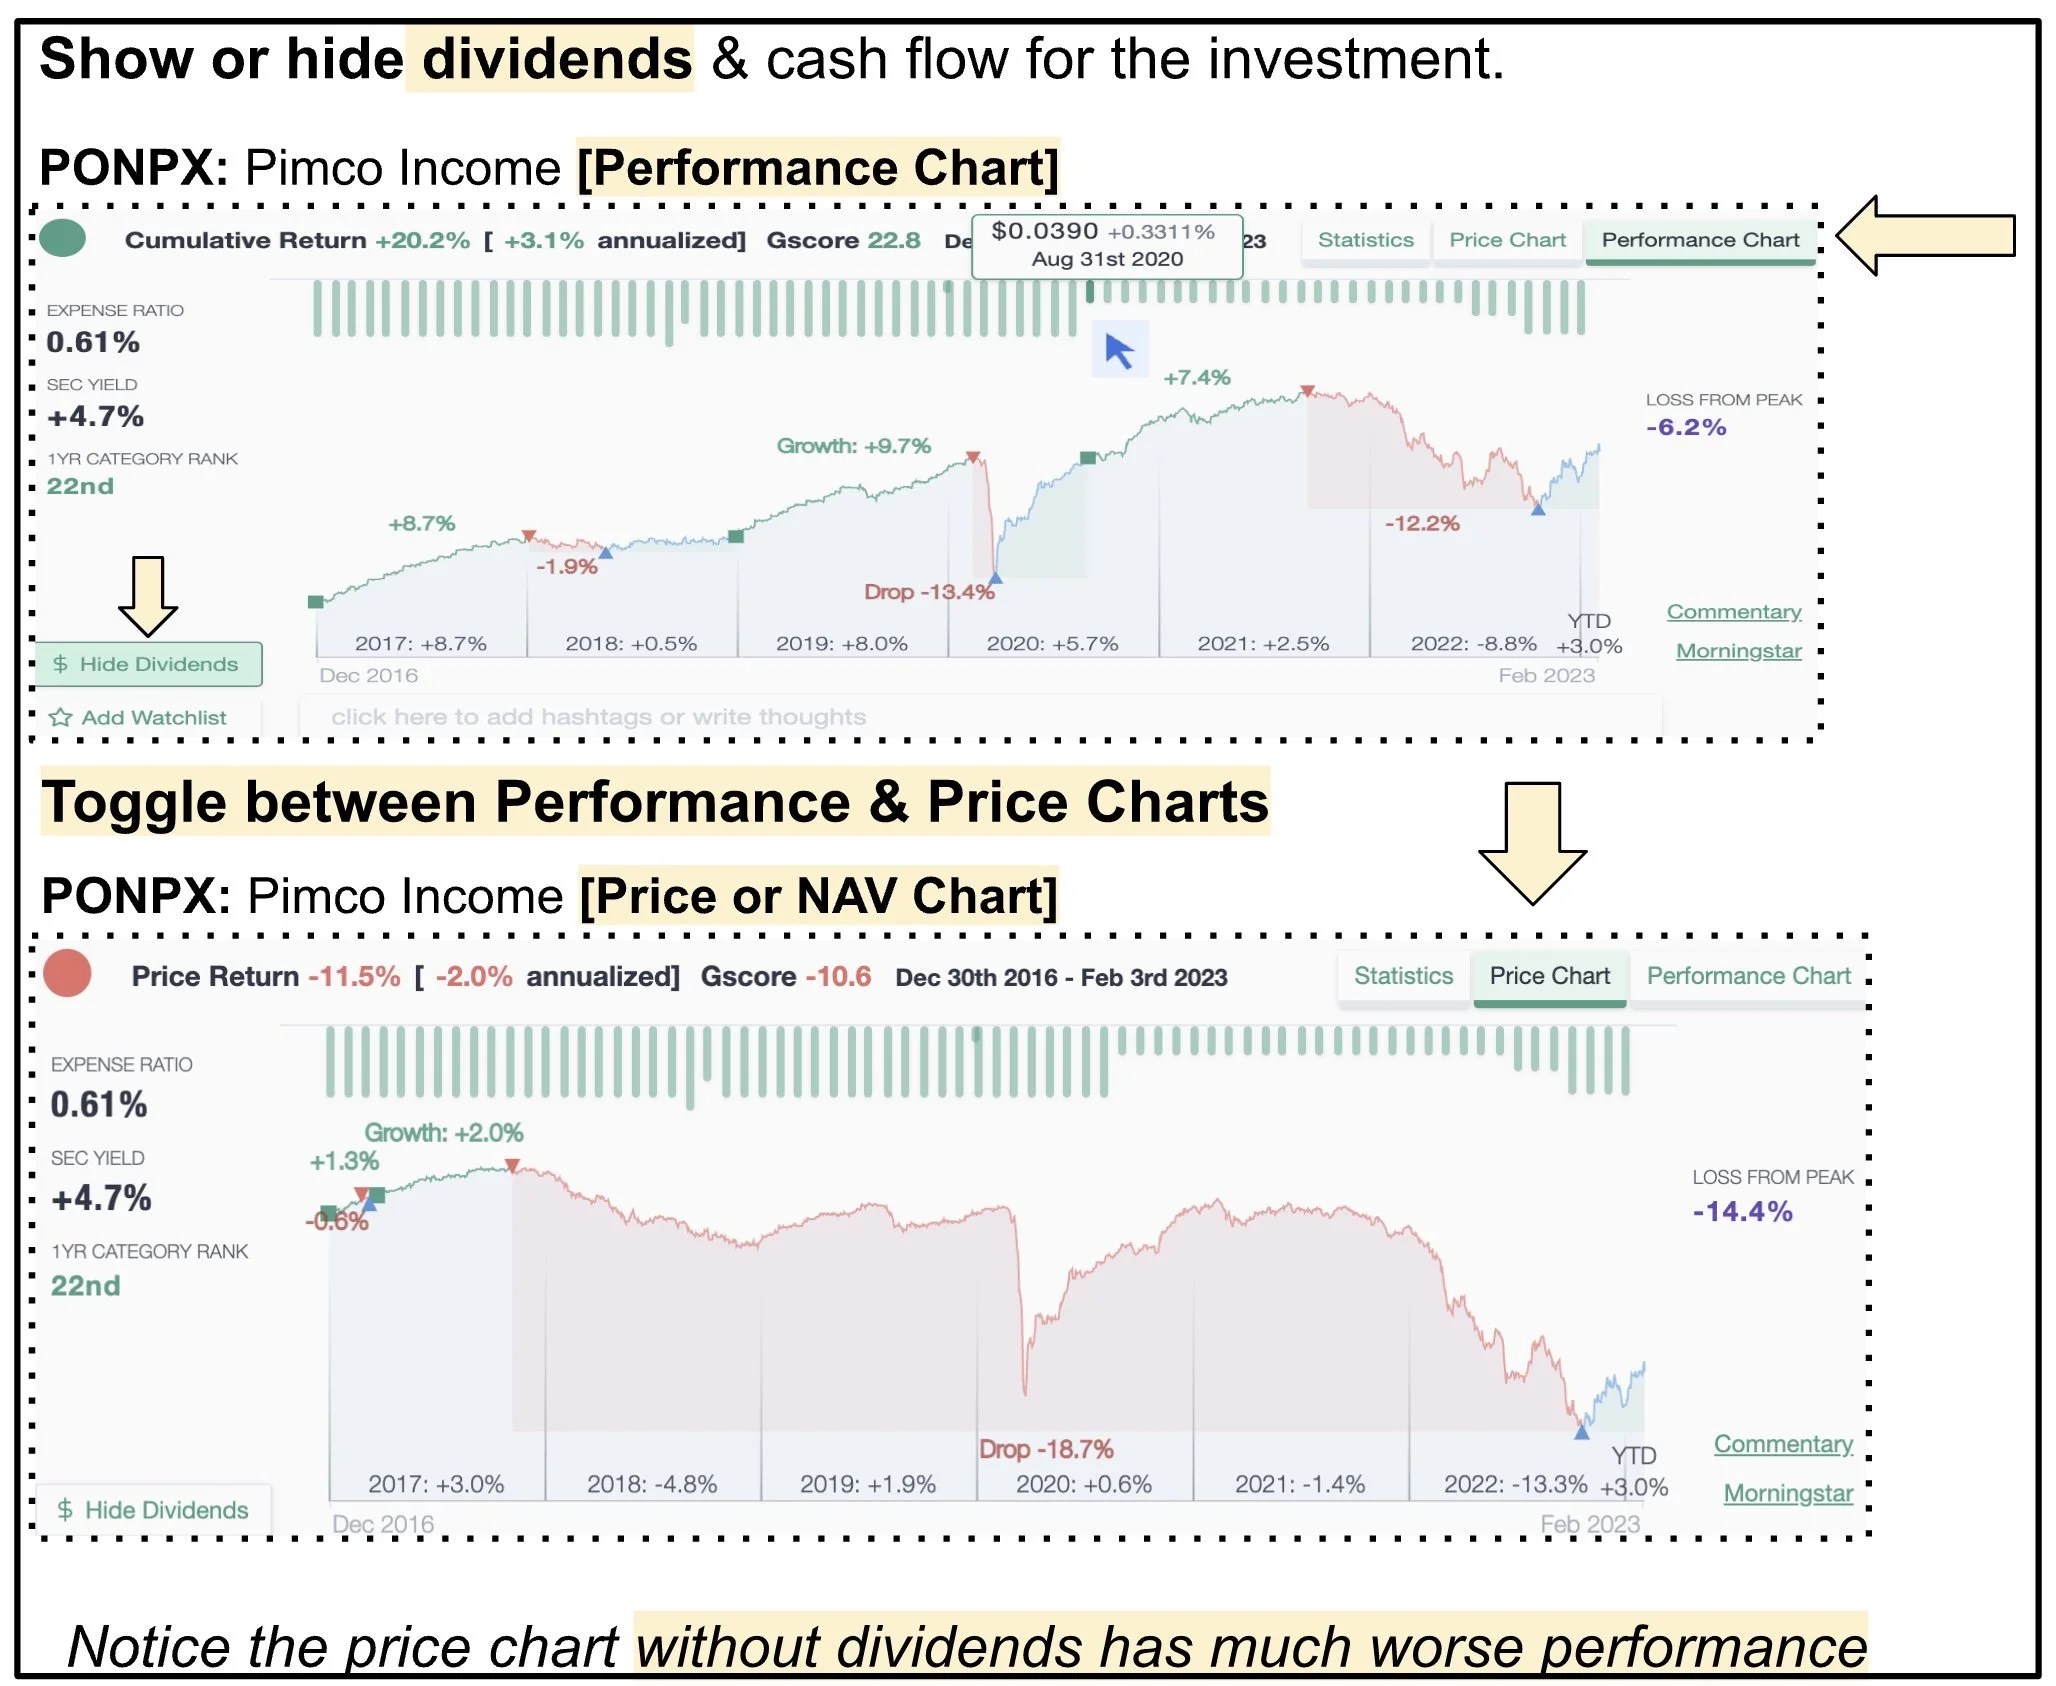
Ability to display dividends, performance, and price charts
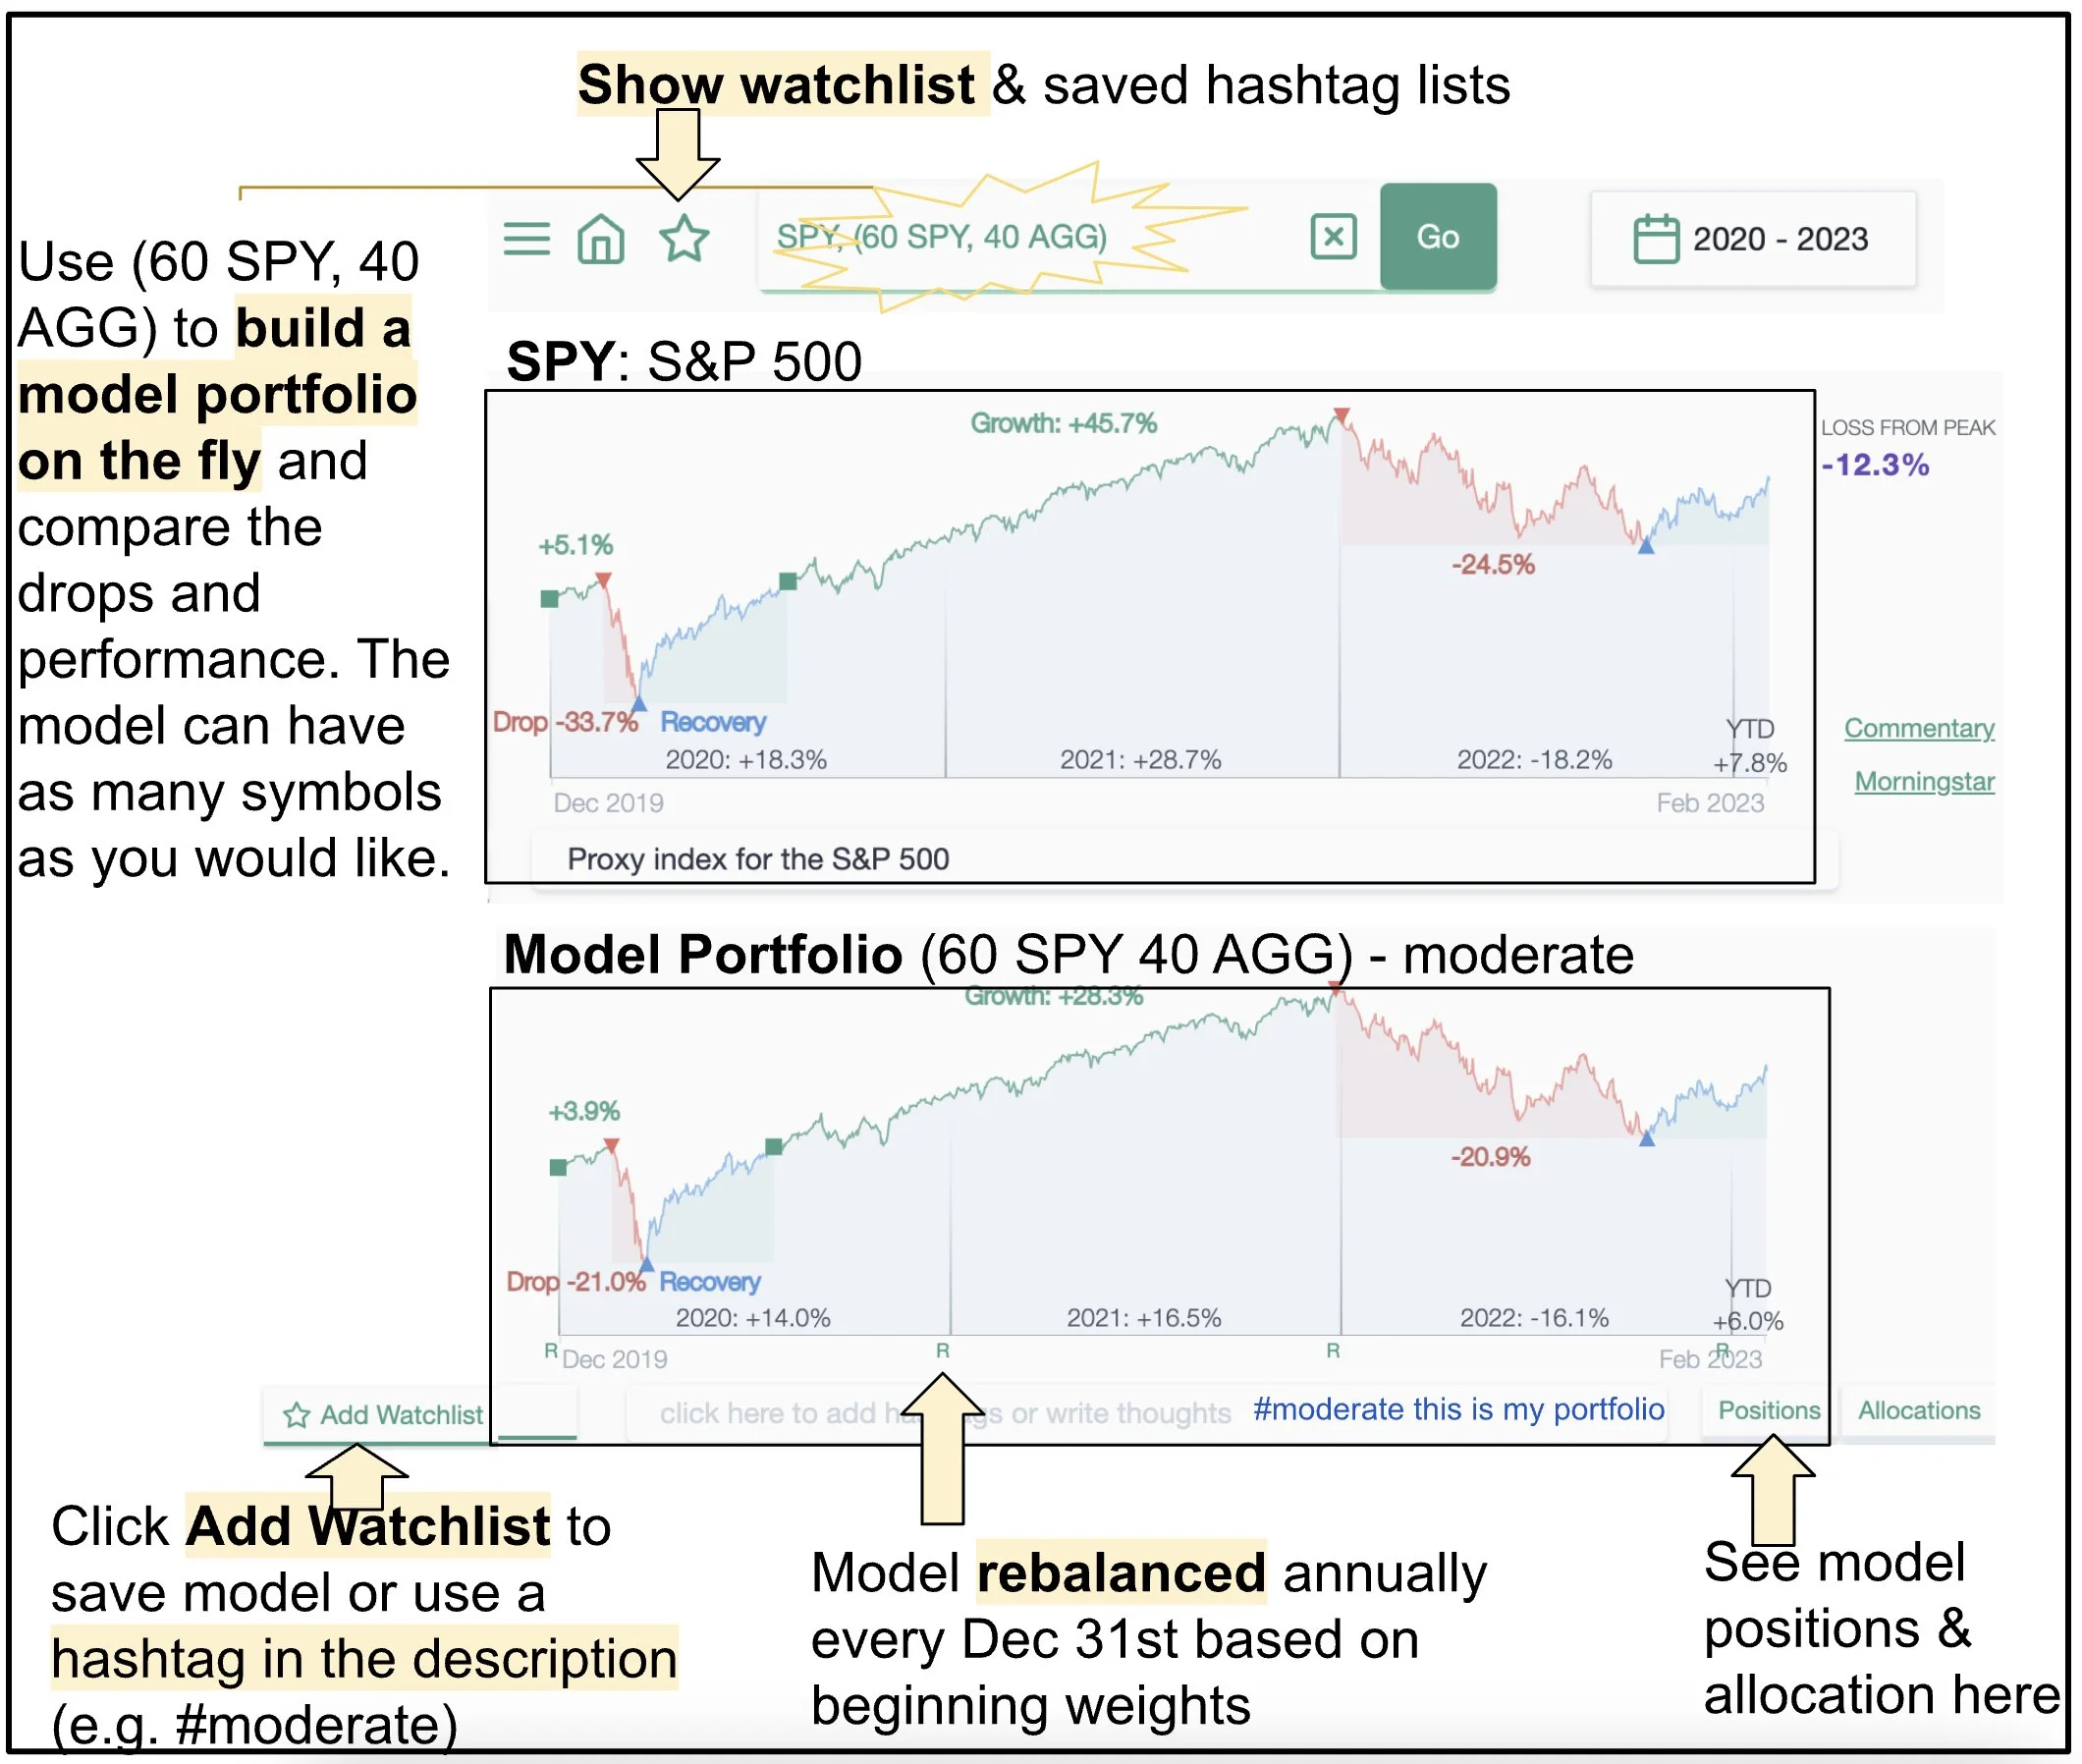
Want to keep up with a stock? Add it to your watchlist
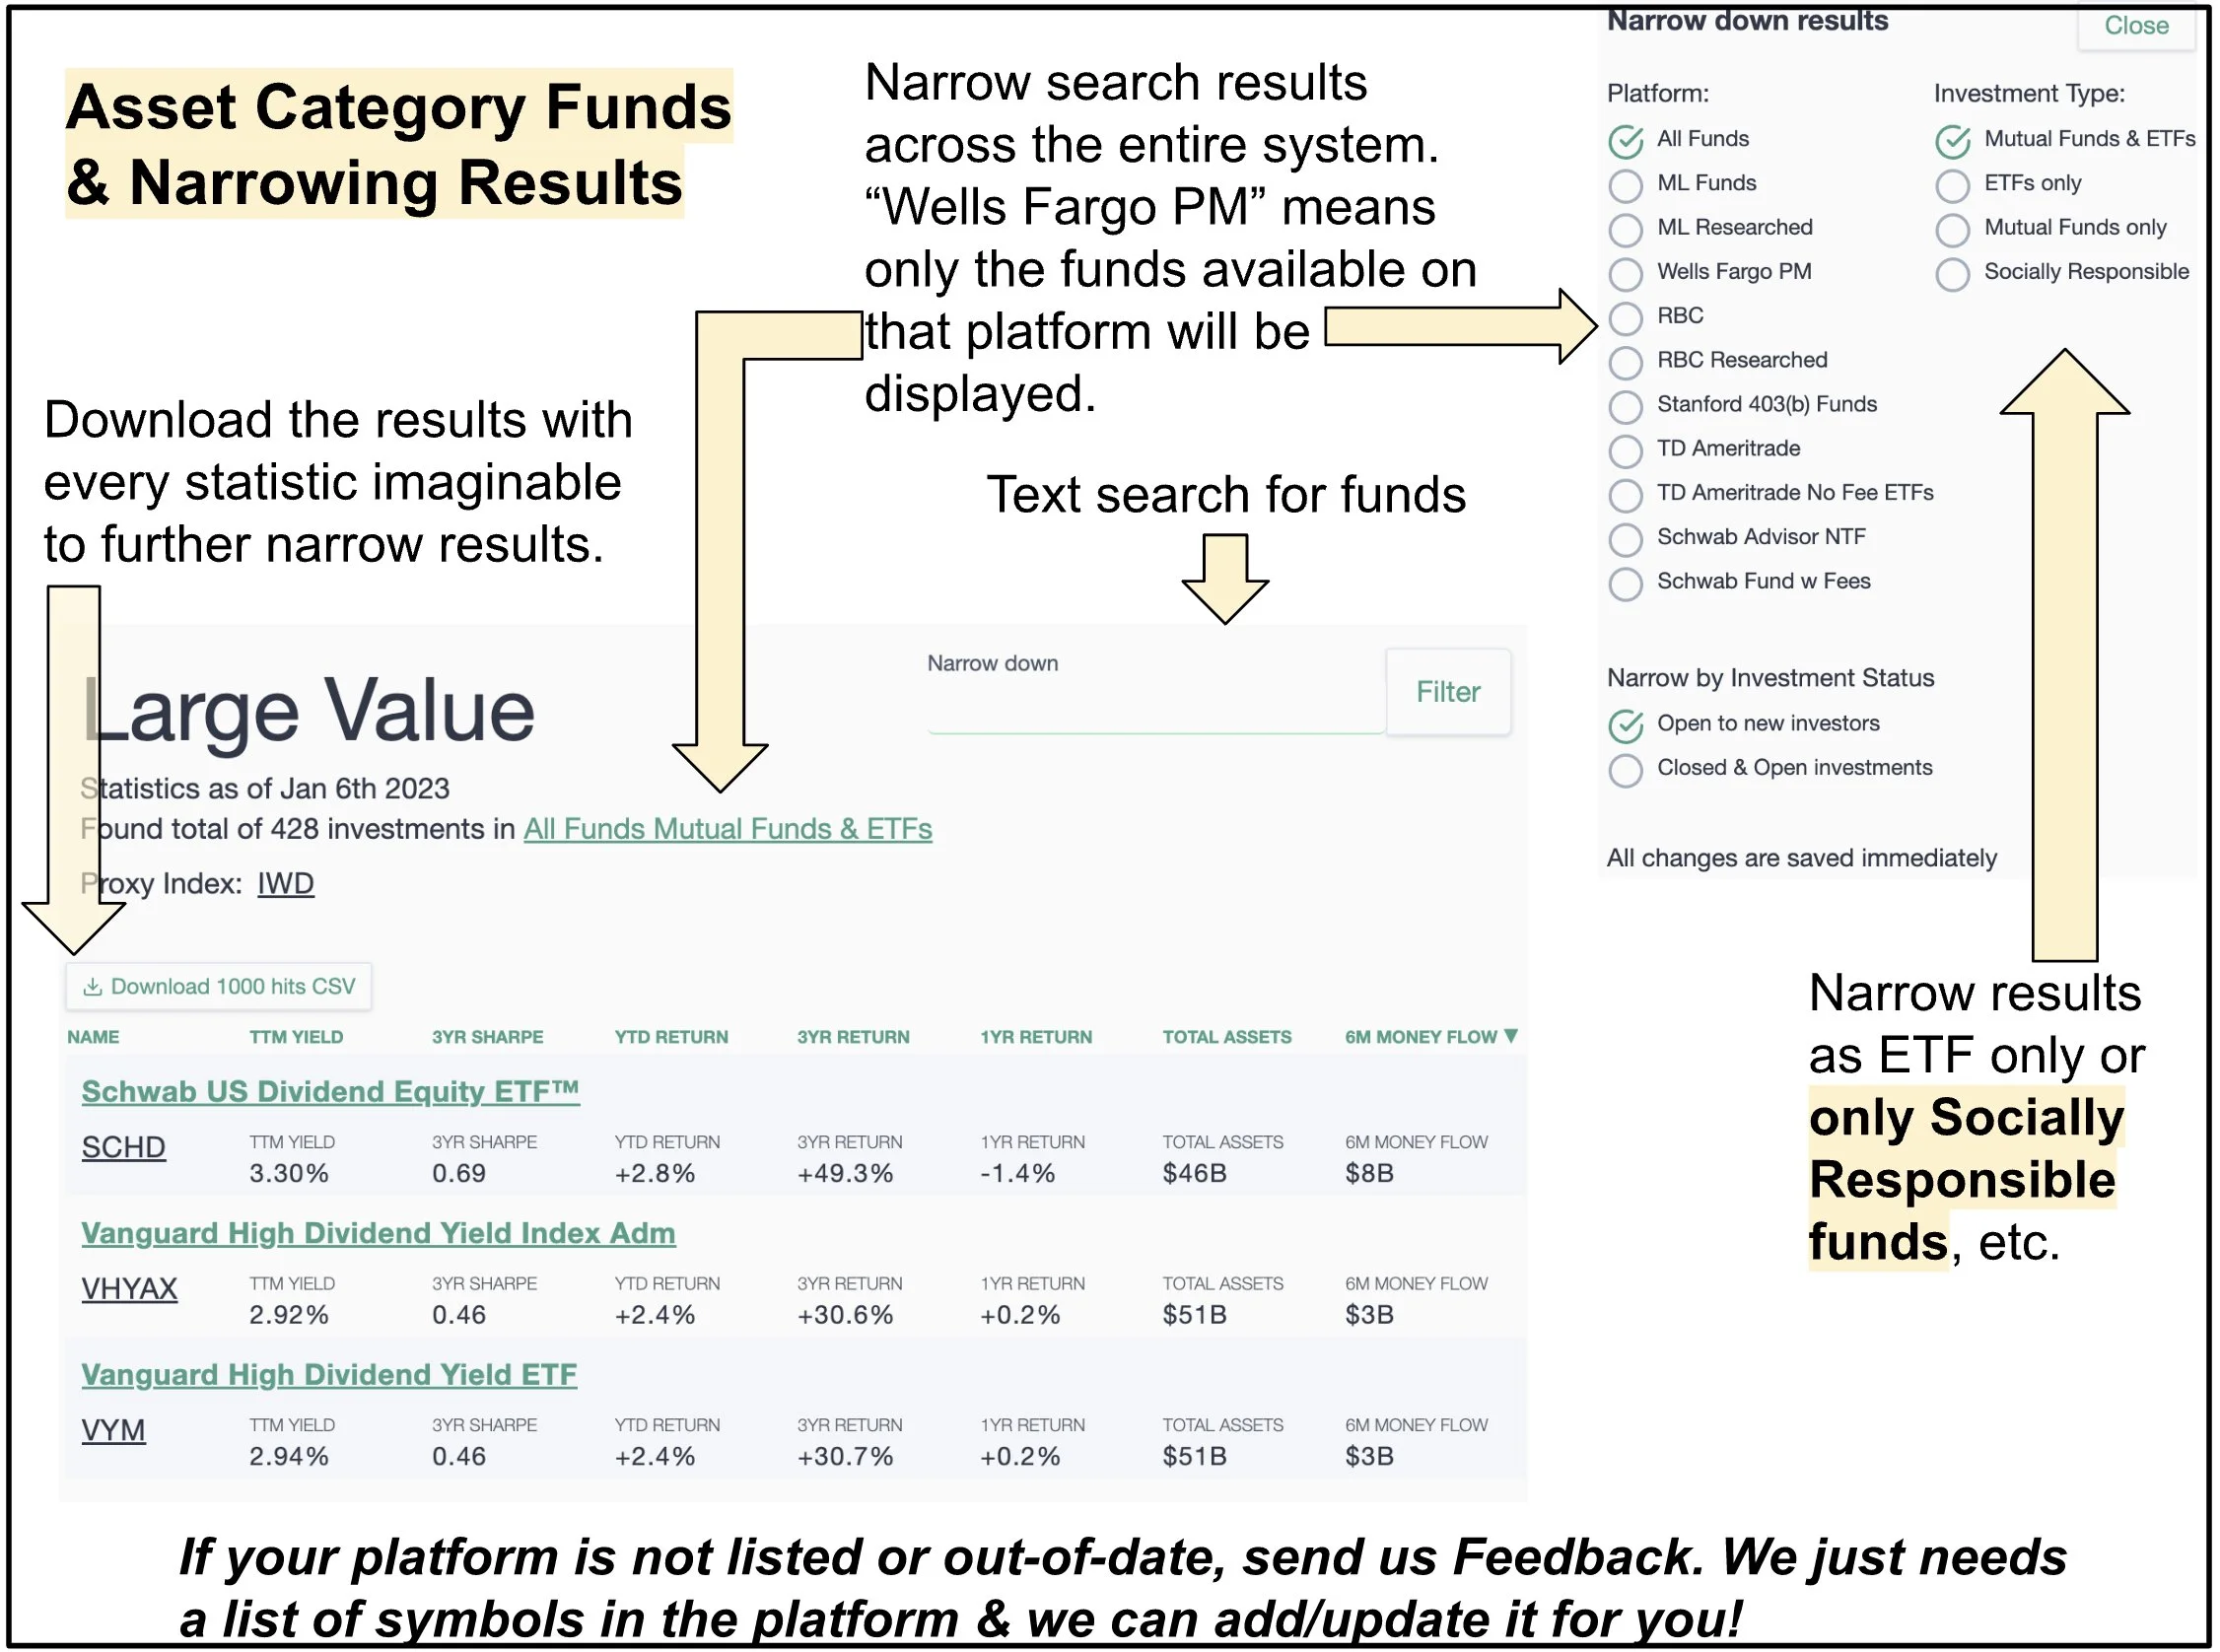
Asset Category Funds & Narrowing Results

Search for specific funds
Fair Advisor Pro is designed for financial advisors at wire houses, broker dealers, and registered investment advisor firms. It includes all of the capabilities of Fair Insight plus:
The ability to import the holdings from your book of business
The ability to import a client prospect’s existing portfolio, including cost basis, unrealized and realized gains and losses, holdings, and transactions. Fair Advisor Pro will then compare the prospect’s portfolio to a benchmark portfolio and the advisor model portfolio
Continuous monitoring of the advisor’s entire book of business, including a holdings evaluation analysis ranking the holdings as red, yellow, or green
Mock trading of a client’s account based on advisor preferences and generated alerts (tax loss harvesting, 1yr or 3yr underperformance compared to the index, opportunist reduction of concentrated positions, etc.)
Based on the imported data, determine the client or prospect’s visual risk score, visual risk/reward quality, and the historical performance. Drill down into Accounts, Holdings, Allocations, Transactions, and Cash Flow. Compare portfolio alternatives. Mock trade portfolios and determine tax consequences.
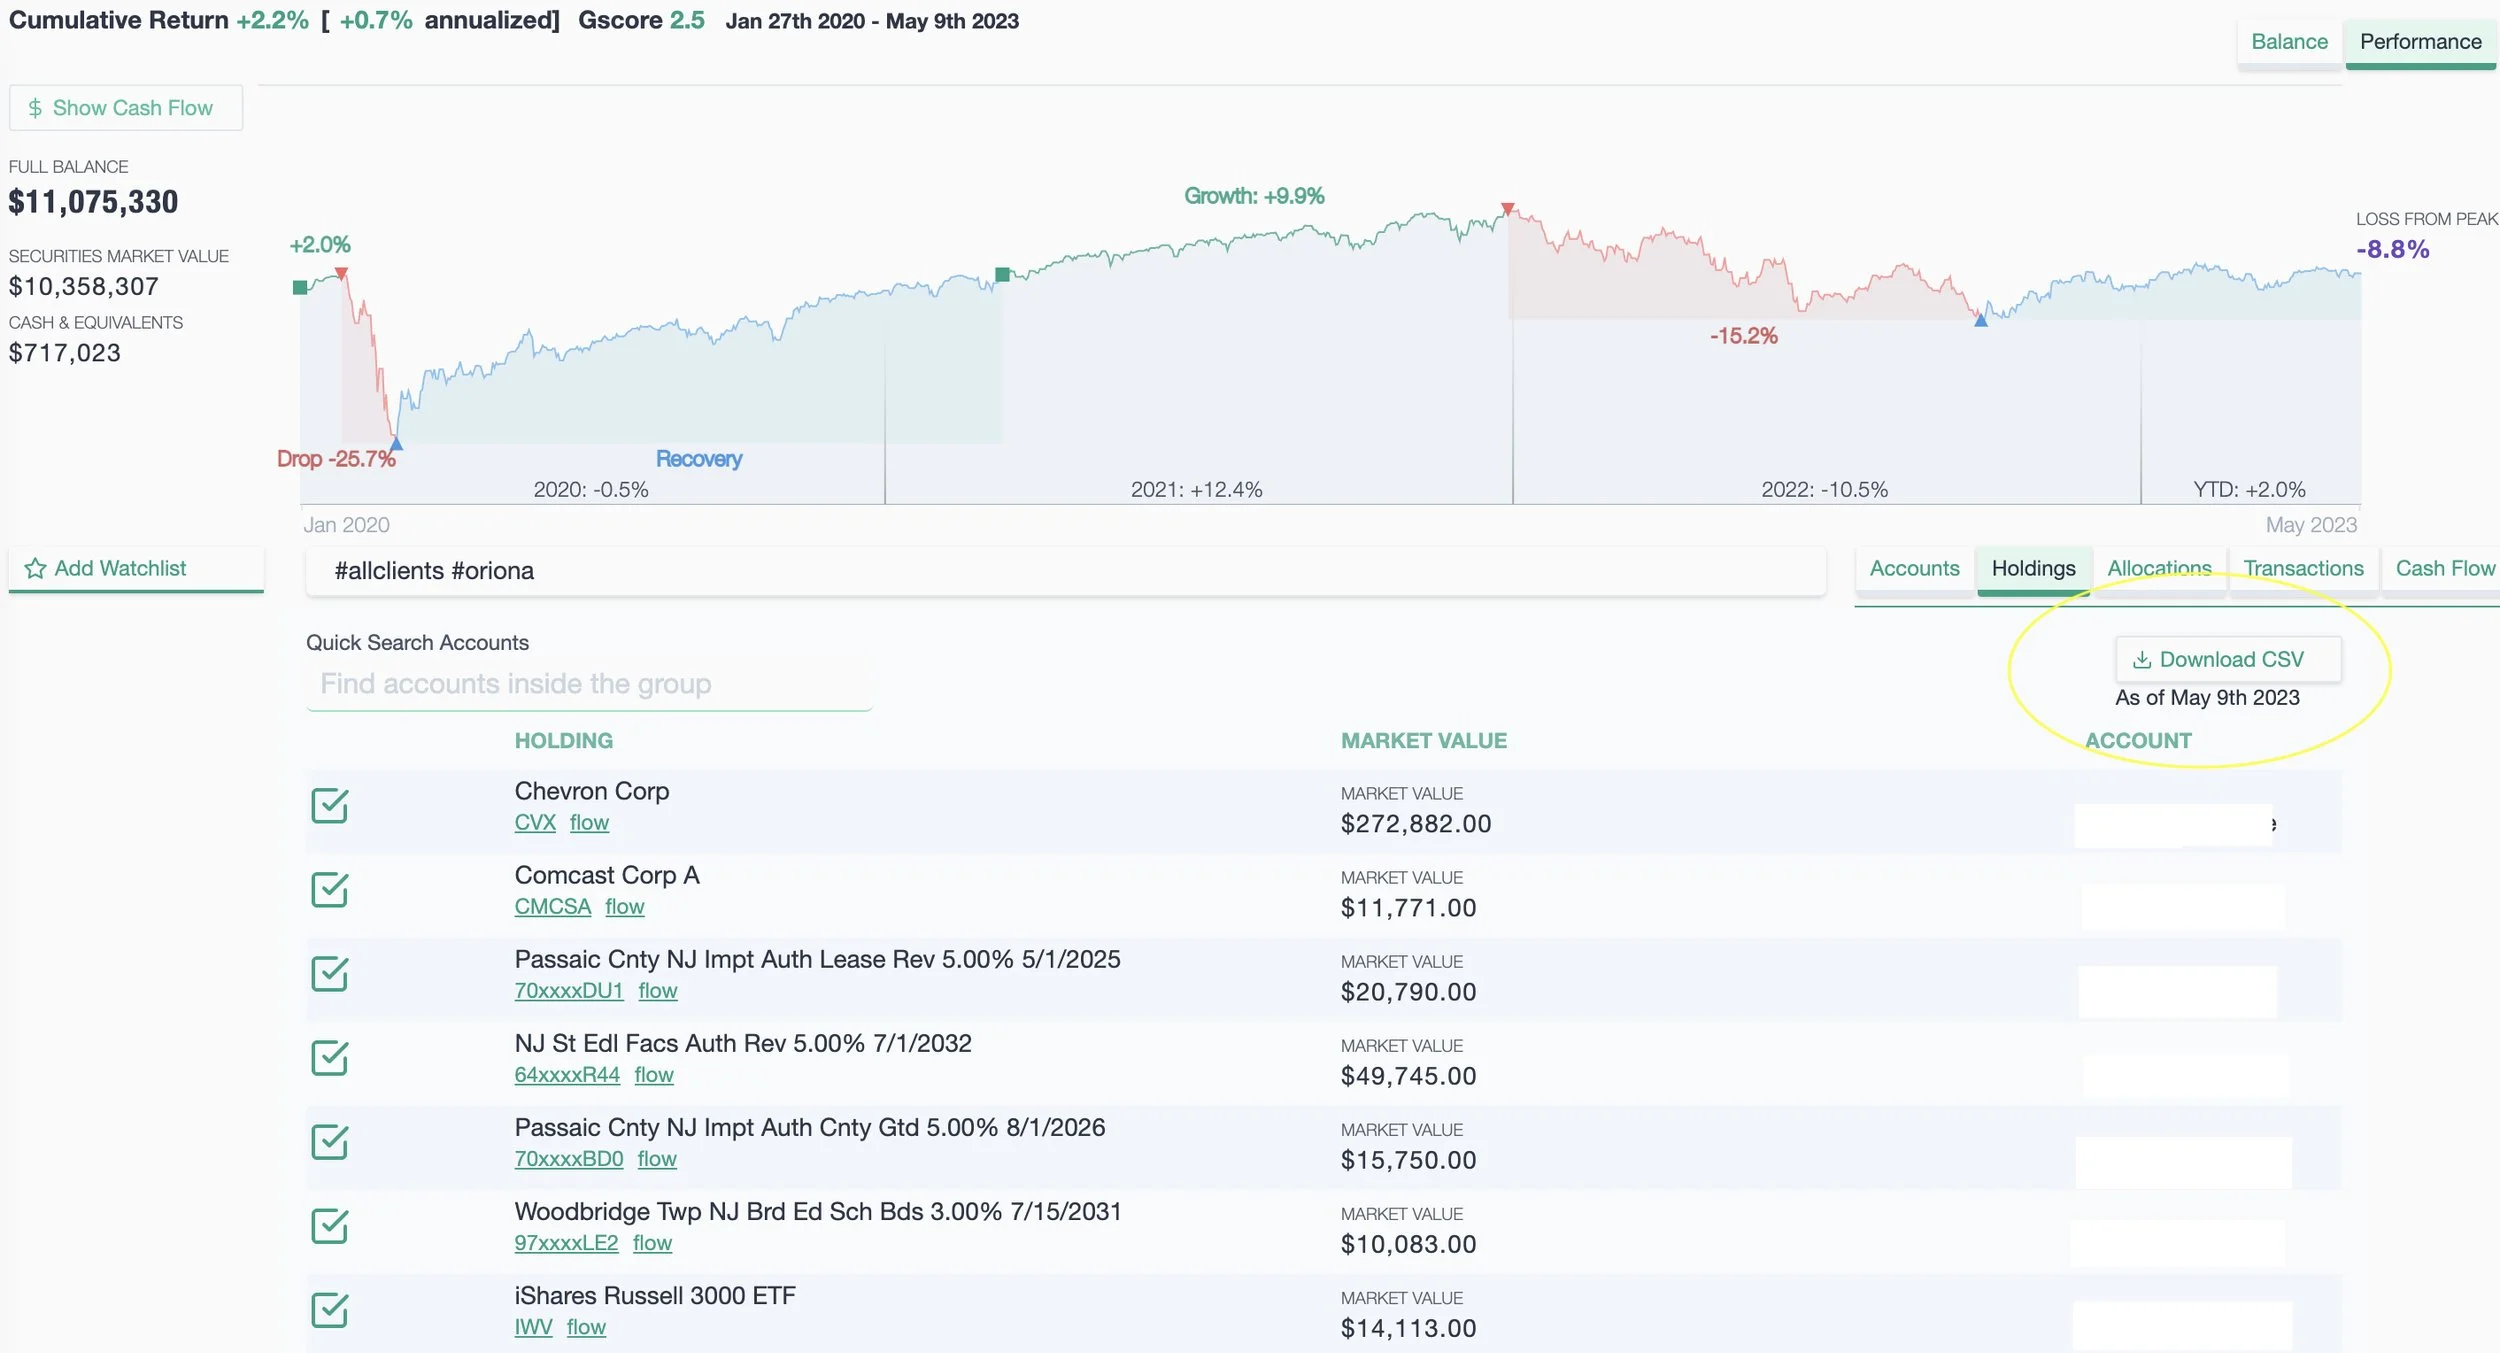
Click on the Holdings tab and then “Download CSV” to see every statistic known for the client or prospect’s holdings. The platform will also evaluate the holdings as red, yellow, or green based on the advisors preferences. If a holding is marked red, the CSV file will mock sell the position in the “Trade” column (-1000 means sell $1000 worth of the holding) along with the share quantity and realized gain/loss information.

The holdings evaluation criteria (red, yellow, green) currently includes the following based on the advisors preferences:
Book & Holdings Analysis
3 Year performance lag vs index
1 Year performance lag vs index
Tax Loss Harvesting opportunity
Concentrated Position
Peer Performance [performance]
Short Term Performance Reversal [performance]
Higher Downside Capture [increased risk during periods of stress]
Lower Diversification [fitness & correlation]
Higher Fee Underperformance [unjustified high cost]
Higher Tax Exposure [larger taxable events]
Hidden Risk [higher tail risk]
Exposure Outliers [exposure inconsistent with category]
Recent Outflows [drift & liquidity impact]
12b-1 fees and/or fund loads fees
Fair Advisor Realtime includes all of the features of Fair Advisor Pro plus a real time integration into your performance management system. Your book of business is updated multiple times a day, including holdings, transactions, cost basis, and allocations..
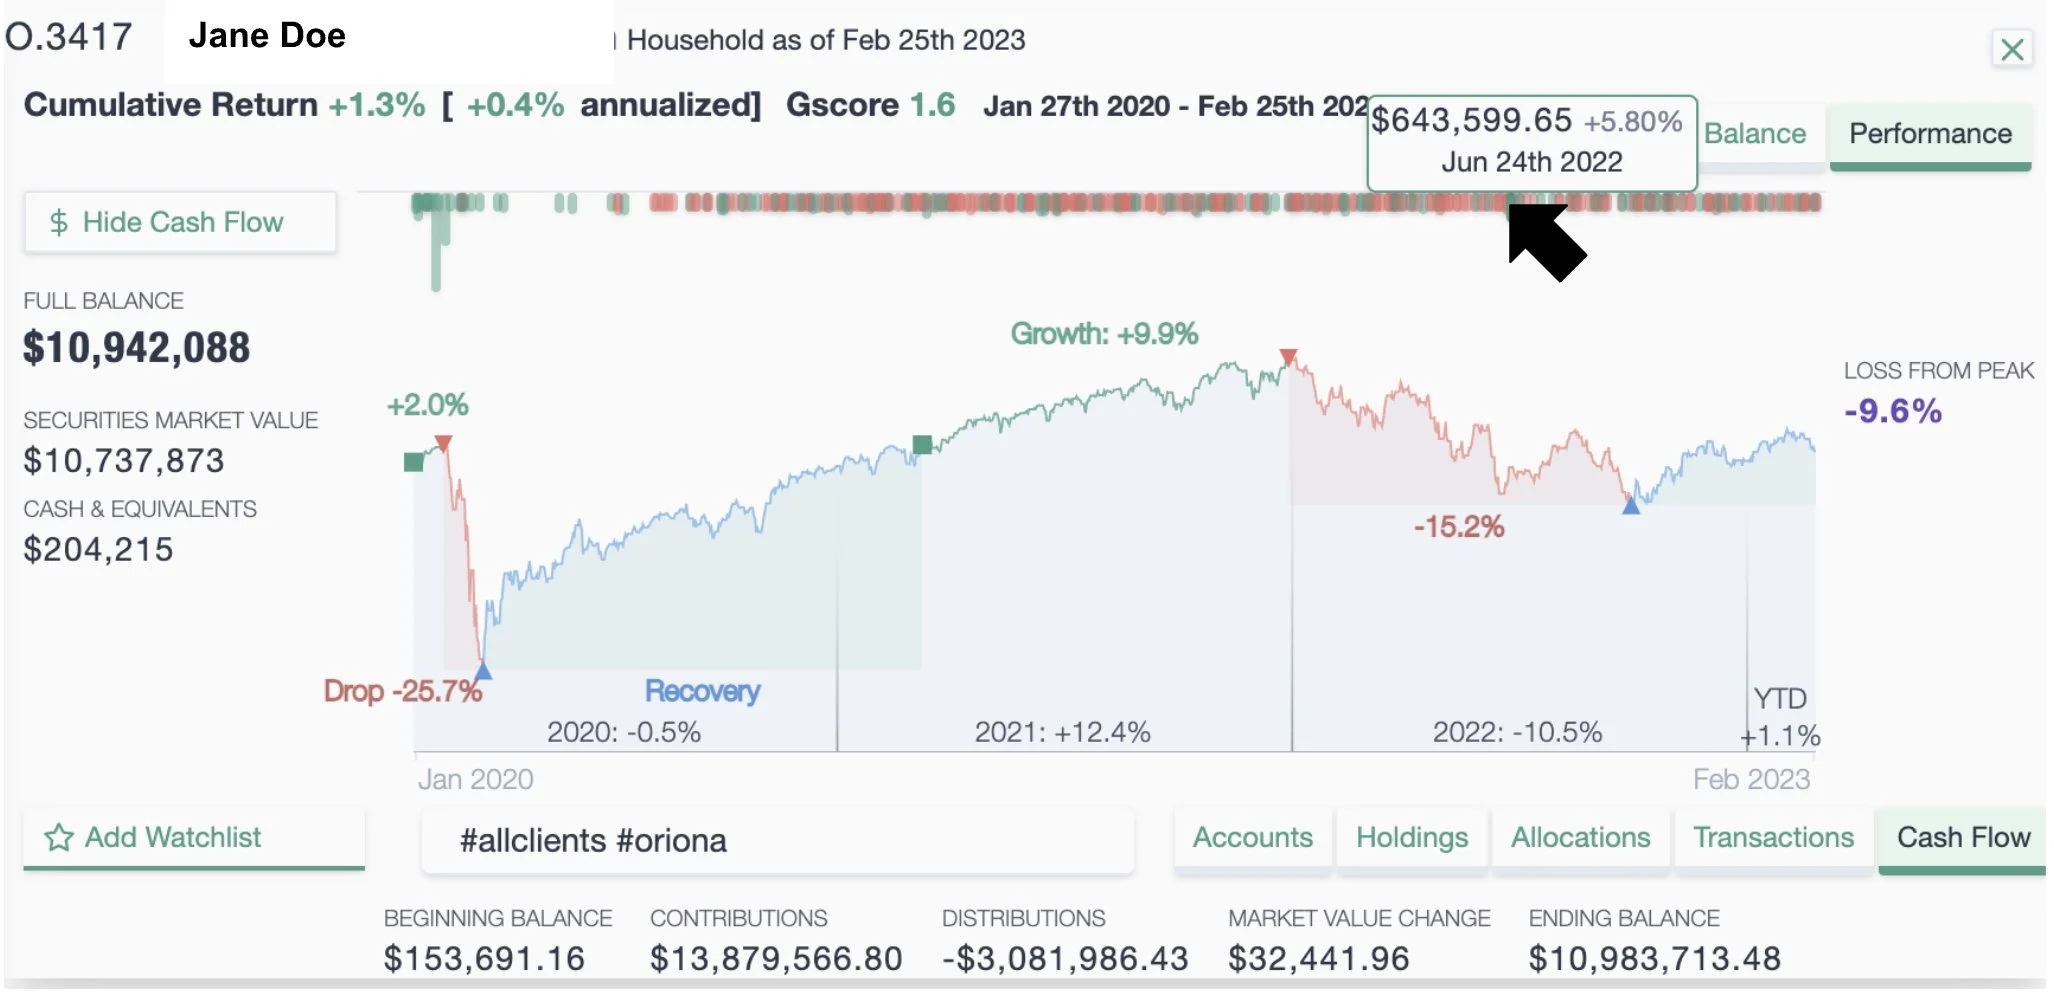
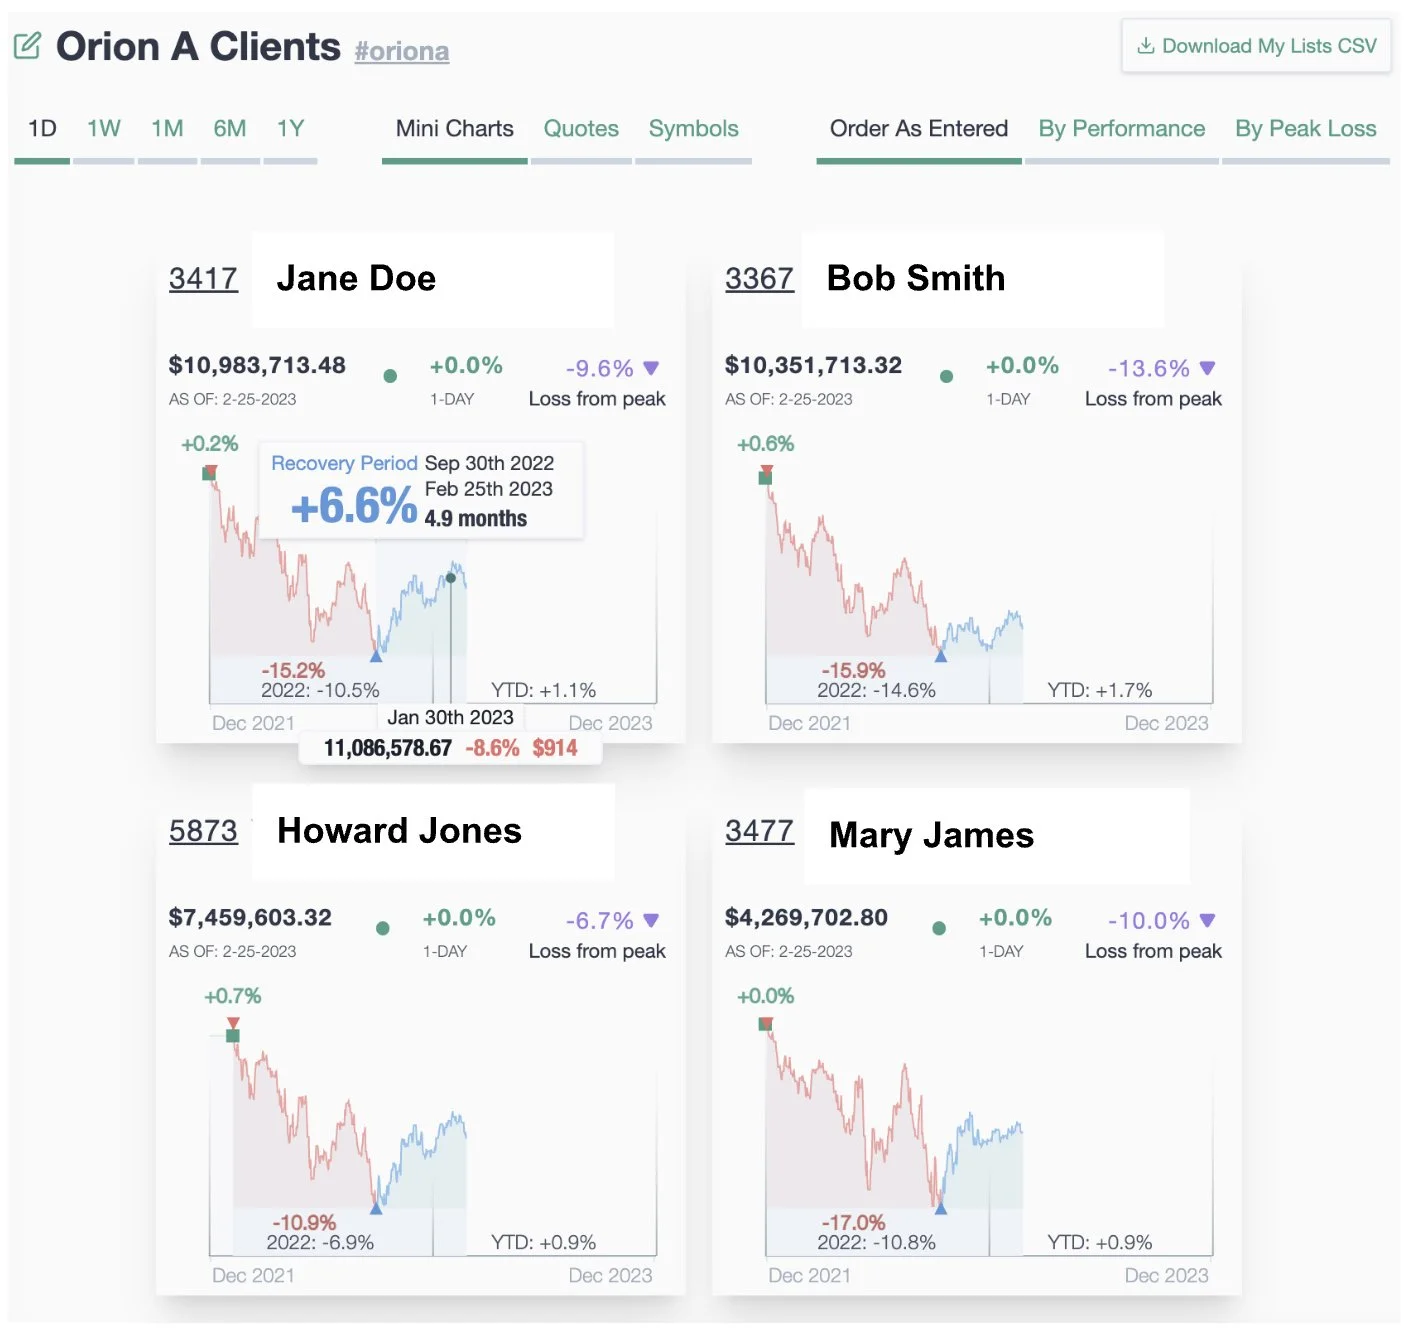
See all of your clients visually in an instant snap!
Each household, account, and asset is treated like a unique symbol in the system.
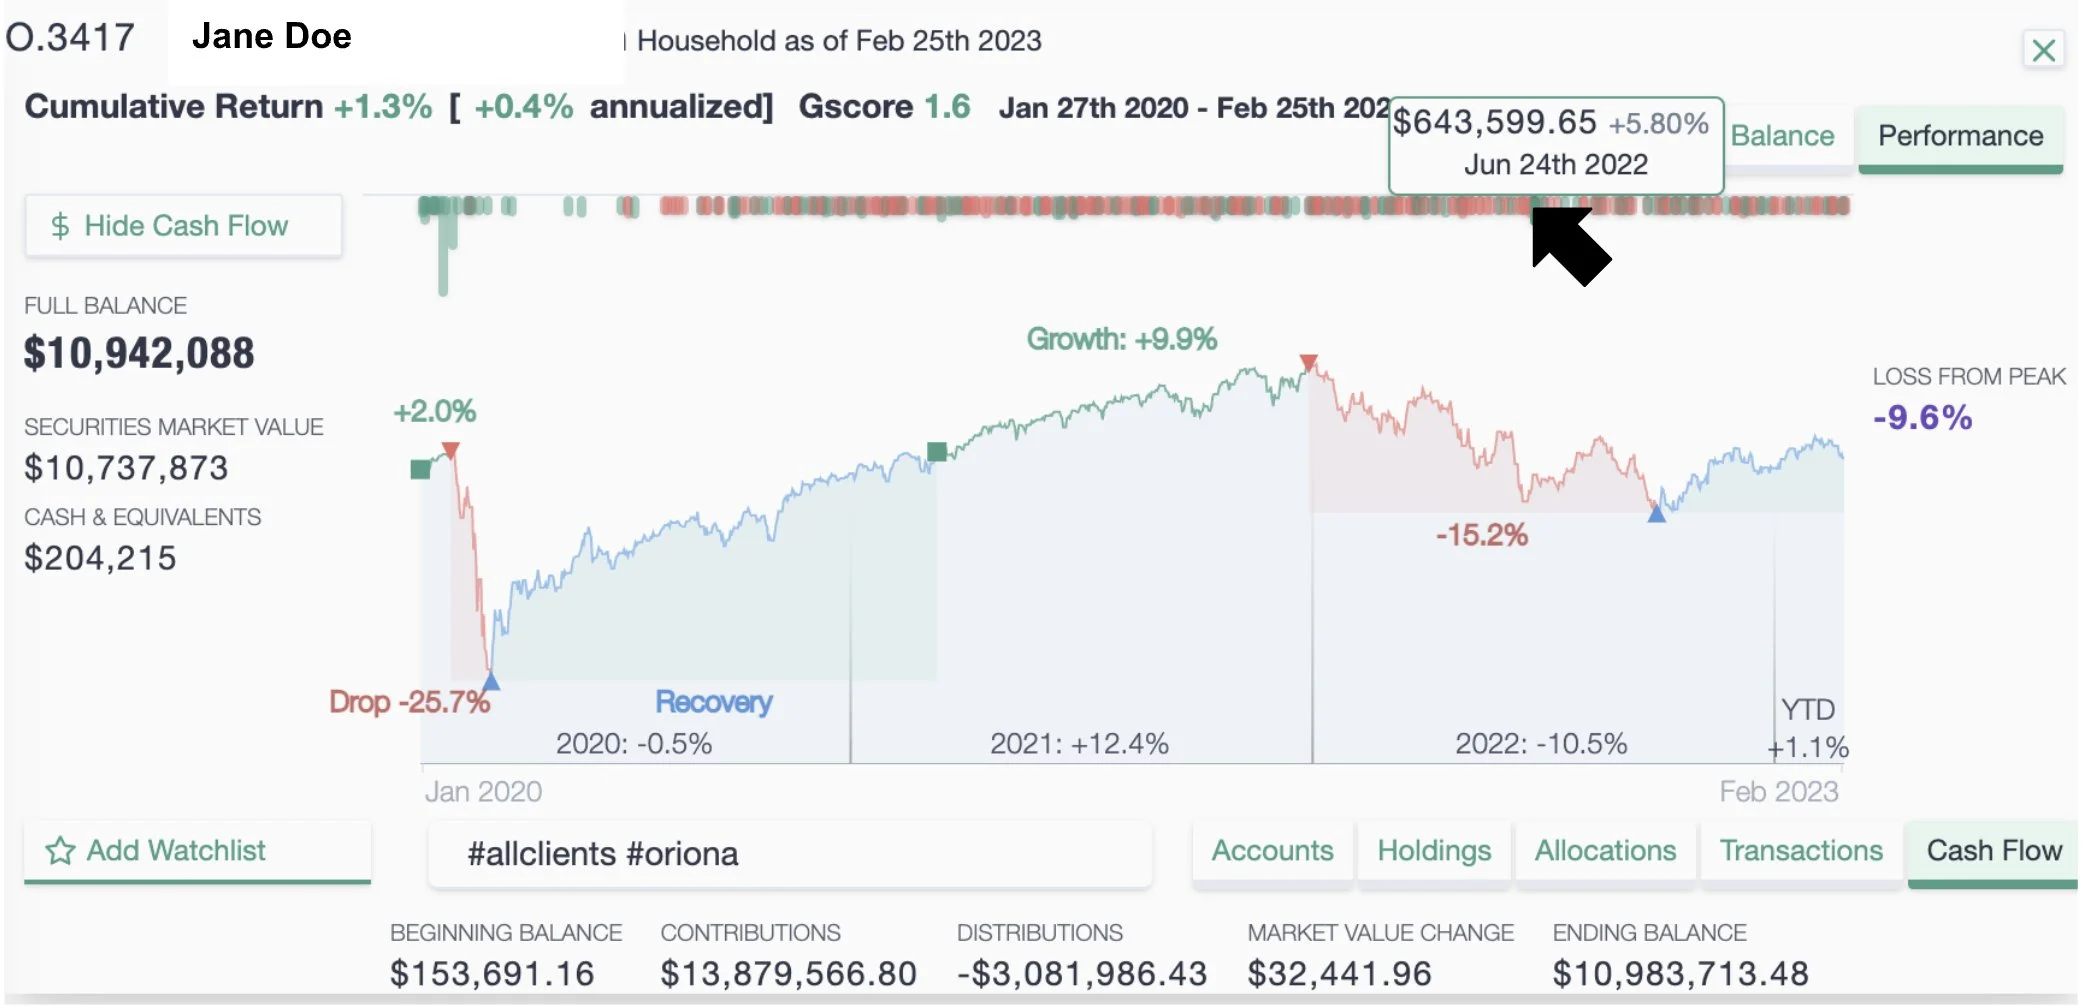
Click and drag to zoom in & see details. Click on the cash flow to see the transactions on that day
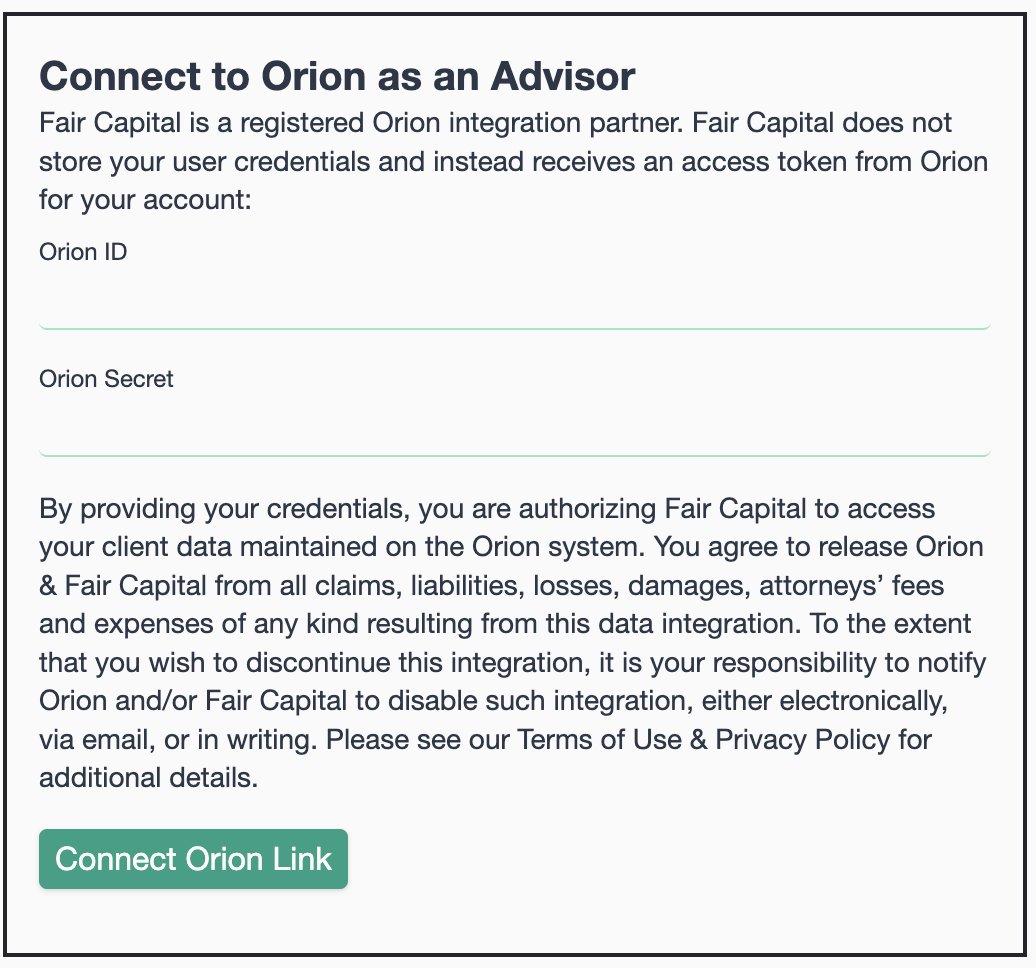
Any user of Orion can provide their user credentials to connect to their book of business:
Assume the client portfolio is invested in stocks, ETFs, and mutual funds:
Sample Execution
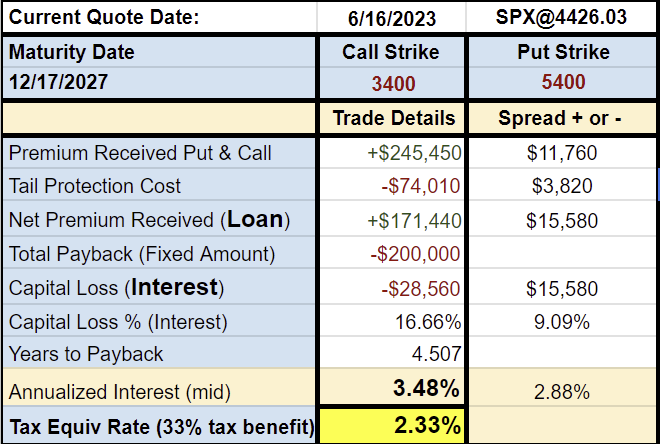
Options
Option 1: Extract Cash
Minimum portfolio size: Total payback multiplied by 2, plus $75,000 (15% of current SPX value)
Actual portfolio size: $500,000
Margin Call Portfolio Size: Total payback divided by 70% plus $75,000 (15% of current SPX value)
Drop before margin call: Actual portfolio size minus margin call portfolio size
% drop before margin call: Drop before margin call divided by actual portfolio size
Option 2: Leverage Cash
Minimum portfolio size: Principal amount borrowed plus capital loss (accrued interest) plus $75,000 (15% of current SPX value)
Levered Portfolio Size: Minimum portfolio size plus net premium received (loan)
Margin Call Portfolio Size: Total payback divided by 70% plus $75,000 (15% of current SPX value)
Drop before margin call: Levered portfolio size minus margin call portfolio size
% drop before margin call: Drop before margin call divided by actual portfolio size
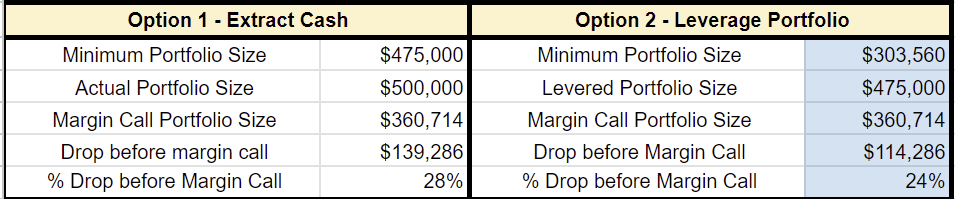
Sample of Options